Automated Cell Therapy Manufacturing Platforms Market Size, Trend, Forecast Report 2026 to 2035
Market Segmentation:
Automated Cell Therapy Manufacturing Platforms Market by Offering -
• Instruments & Hardware Systems
o Integrated / End-to-End Platforms
o Modular Unit-Operation Instruments
o Robotic Orchestration Hardware
• Consumables, Cassettes & Process Kits
o Single-Use Cassettes & Tubing Sets
o Process Kits, Chambers & Flow Paths
o Platform-Dedicated Reagent & Selection Kits
• Software & Digital Orchestration
• Services
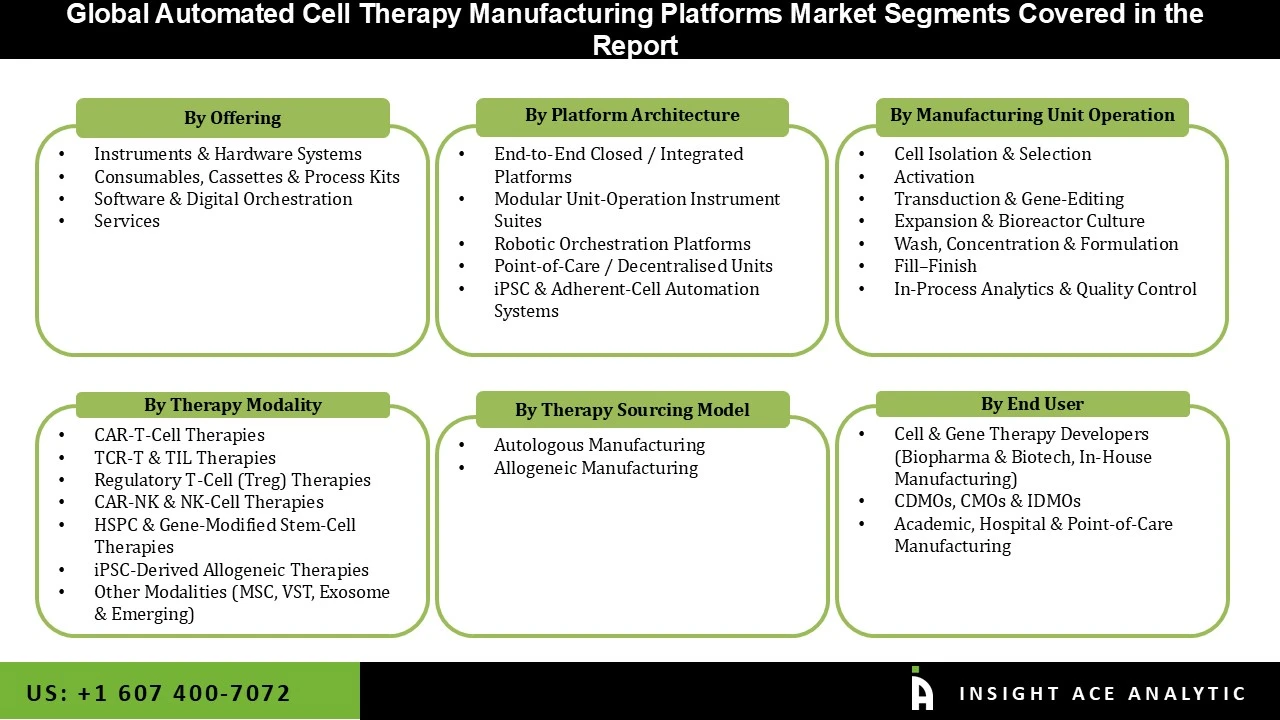
Automated Cell Therapy Manufacturing Platforms Market by Platform Architecture -
• End-to-End Closed / Integrated Platforms
• Modular Unit-Operation Instrument Suites
• Robotic Orchestration Platforms
• Point-of-Care / Decentralised Units
• iPSC & Adherent-Cell Automation Systems
Automated Cell Therapy Manufacturing Platforms Market by Manufacturing Unit Operation -
• Cell Isolation & Selection
• Activation
• Transduction & Gene-Editing
o Viral Transduction
o Non-Viral Gene Delivery & Electroporation
• Expansion & Bioreactor Culture
• Wash, Concentration & Formulation
• Fill–Finish
• In-Process Analytics & Quality Control
Automated Cell Therapy Manufacturing Platforms Market by Therapy Modality -
• CAR-T-Cell Therapies
• TCR-T & TIL Therapies
• Regulatory T-Cell (Treg) Therapies
• CAR-NK & NK-Cell Therapies
• HSPC & Gene-Modified Stem-Cell Therapies
• iPSC-Derived Allogeneic Therapies
• Other Modalities (MSC, VST, Exosome & Emerging)
Automated Cell Therapy Manufacturing Platforms Market by Therapy Sourcing Model -
• Autologous Manufacturing
• Allogeneic Manufacturing
Automated Cell Therapy Manufacturing Platforms Market by End User -
• Cell & Gene Therapy Developers (Biopharma & Biotech, In-House Manufacturing)
• CDMOs, CMOs & IDMOs
• Academic, Hospital & Point-of-Care Manufacturing
Automated Cell Therapy Manufacturing Platforms Market by Region-
North America-
• The US
• Canada
• Mexico
Europe-
• Germany
• The UK
• France
• Italy
• Spain
• Rest of Europe
Asia-Pacific-
• China
• Japan
• India
• South Korea
• South East Asia
• Rest of Asia Pacific
Latin America-
• Brazil
• Argentina
• Rest of Latin America
Middle East & Africa-
• GCC Countries
• South Africa
• Rest of Middle East and Africa
Chapter 1. Methodology and Scope
1.1. Research Methodology
1.2. Research Scope & Assumptions
Chapter 2. Executive Summary
Chapter 3. Global Automated Cell Therapy Manufacturing Platforms Market Snapshot
Chapter 4. Global Automated Cell Therapy Manufacturing Platforms Market Variables, Trends & Scope
4.1. Market Segmentation & Scope
4.2. Market Drivers
4.3. Market Challenges
4.4. Market Trends
4.5. Cell Therapy Manufacturing Regulatory and Technology Landscape
4.6. Porter’s Five Forces Analysis
4.7. Incremental Opportunity Analysis (US$ Mn), 2025–2035
4.8. Market Penetration & Growth Prospect Mapping (US$ Mn), 2026–2035
4.9. Competitive Landscape & Market Share Analysis, 2026
4.10. Impact of Closed-System Manufacturing, Robotic Automation, and Digital Process Orchestration on the Automated Cell Therapy Manufacturing Platforms Market
Chapter 5. Automated Cell Therapy Manufacturing Platforms Market Segmentation: By Offering
5.1. Market Share, 2025 & 2035
5.2. Market Size (US$ Mn), 2022–2035
5.2.1. Instruments & Hardware Systems
5.2.1.1. Integrated / End-to-End Platforms
5.2.1.2. Modular Unit-Operation Instruments
5.2.1.3. Robotic Orchestration Hardware
5.2.2. Consumables, Cassettes & Process Kits
5.2.2.1. Single-Use Cassettes & Tubing Sets
5.2.2.2. Process Kits, Chambers & Flow Paths
5.2.2.3. Platform-Dedicated Reagent & Selection Kits
5.2.3. Software & Digital Orchestration
5.2.4. Services
Chapter 6. Automated Cell Therapy Manufacturing Platforms Market Segmentation: By Platform Architecture
6.1. Market Share, 2025 & 2035
6.2. Market Size (US$ Mn), 2022–2035
6.2.1. End-to-End Closed / Integrated Platforms
6.2.2. Modular Unit-Operation Instrument Suites
6.2.3. Robotic Orchestration Platforms
6.2.4. Point-of-Care / Decentralised Units
6.2.5. iPSC & Adherent-Cell Automation Systems
Chapter 7. Automated Cell Therapy Manufacturing Platforms Market Segmentation: By Manufacturing Unit Operation
7.1. Market Share, 2025 & 2035
7.2. Market Size (US$ Mn), 2022–2035
7.2.1. Cell Isolation & Selection
7.2.2. Activation
7.2.3. Transduction & Gene-Editing
7.2.3.1. Viral Transduction
7.2.3.2. Non-Viral Gene Delivery & Electroporation
7.2.4. Expansion & Bioreactor Culture
7.2.5. Wash, Concentration & Formulation
7.2.6. Fill–Finish
7.2.7. In-Process Analytics & Quality Control
Chapter 8. Automated Cell Therapy Manufacturing Platforms Market Segmentation: By Therapy Modality
8.1. Market Share, 2025 & 2035
8.2. Market Size (US$ Mn), 2022–2035
8.2.1. CAR-T-Cell Therapies
8.2.2. TCR-T & TIL Therapies
8.2.3. Regulatory T-Cell (Treg) Therapies
8.2.4. CAR-NK & NK-Cell Therapies
8.2.5. HSPC & Gene-Modified Stem-Cell Therapies
8.2.6. iPSC-Derived Allogeneic Therapies
8.2.7. Other Modalities (MSC, VST, Exosome & Emerging)
Chapter 9. Automated Cell Therapy Manufacturing Platforms Market Segmentation: By Therapy Sourcing Model
9.1. Market Share, 2025 & 2035
9.2. Market Size (US$ Mn), 2022–2035
9.2.1. Autologous Manufacturing
9.2.2. Allogeneic Manufacturing
Chapter 10. Automated Cell Therapy Manufacturing Platforms Market Segmentation: By End User
10.1. Market Share, 2025 & 2035
10.2. Market Size (US$ Mn), 2022–2035
10.2.1. Cell & Gene Therapy Developers (Biopharma & Biotech, In-House Manufacturing)
10.2.2. CDMOs, CMOs & IDMOs
10.2.3. Academic, Hospital & Point-of-Care Manufacturing
Chapter 11. Regional Automated Cell Therapy Manufacturing Platforms Market Estimates & Trend Analysis
11.1. Global Market Regional Snapshot, 2025 & 2035
11.2. North America
11.2.1. Market Revenue by Country (U.S., Canada, Mexico), 2022–2035
11.2.2. North America Automated Cell Therapy Manufacturing Platforms Market Revenue by Offering, 2022–2035
11.2.3. North America Automated Cell Therapy Manufacturing Platforms Market Revenue by Platform Architecture, 2022–2035
11.2.4. North America Automated Cell Therapy Manufacturing Platforms Market Revenue by Manufacturing Unit Operation, 2022–2035
11.2.5. North America Automated Cell Therapy Manufacturing Platforms Market Revenue by Therapy Modality, 2022–2035
11.2.6. North America Automated Cell Therapy Manufacturing Platforms Market Revenue by Therapy Sourcing Model, 2022–2035
11.2.7. North America Automated Cell Therapy Manufacturing Platforms Market Revenue by End User, 2022–2035
11.3. Europe
11.3.1. Market Revenue by Country, 2022–2035
11.3.2. Europe Automated Cell Therapy Manufacturing Platforms Market Revenue by Offering, 2022–2035
11.3.3. Europe Automated Cell Therapy Manufacturing Platforms Market Revenue by Platform Architecture, 2022–2035
11.3.4. Europe Automated Cell Therapy Manufacturing Platforms Market Revenue by Manufacturing Unit Operation, 2022–2035
11.3.5. Europe Automated Cell Therapy Manufacturing Platforms Market Revenue by Therapy Modality, 2022–2035
11.3.6. Europe Automated Cell Therapy Manufacturing Platforms Market Revenue by Therapy Sourcing Model, 2022–2035
11.3.7. Europe Automated Cell Therapy Manufacturing Platforms Market Revenue by End User, 2022–2035
11.4. Asia Pacific
11.4.1. Market Revenue by Country, 2022–2035
11.4.2. Asia Pacific Automated Cell Therapy Manufacturing Platforms Market Revenue by Offering, 2022–2035
11.4.3. Asia Pacific Automated Cell Therapy Manufacturing Platforms Market Revenue by Platform Architecture, 2022–2035
11.4.4. Asia Pacific Automated Cell Therapy Manufacturing Platforms Market Revenue by Manufacturing Unit Operation, 2022–2035
11.4.5. Asia Pacific Automated Cell Therapy Manufacturing Platforms Market Revenue by Therapy Modality, 2022–2035
11.4.6. Asia Pacific Automated Cell Therapy Manufacturing Platforms Market Revenue by Therapy Sourcing Model, 2022–2035
11.4.7. Asia Pacific Automated Cell Therapy Manufacturing Platforms Market Revenue by End User, 2022–2035
11.5. Latin America
11.5.1. Market Revenue by Country, 2022–2035
11.5.2. Latin America Automated Cell Therapy Manufacturing Platforms Market Revenue by Offering, 2022–2035
11.5.3. Latin America Automated Cell Therapy Manufacturing Platforms Market Revenue by Platform Architecture, 2022–2035
11.5.4. Latin America Automated Cell Therapy Manufacturing Platforms Market Revenue by Manufacturing Unit Operation, 2022–2035
11.5.5. Latin America Automated Cell Therapy Manufacturing Platforms Market Revenue by Therapy Modality, 2022–2035
11.5.6. Latin America Automated Cell Therapy Manufacturing Platforms Market Revenue by Therapy Sourcing Model, 2022–2035
11.5.7. Latin America Automated Cell Therapy Manufacturing Platforms Market Revenue by End User, 2022–2035
11.6. Middle East & Africa
11.6.1. Market Revenue by Country, 2022–2035
11.6.2. Middle East & Africa Automated Cell Therapy Manufacturing Platforms Market Revenue by Offering, 2022–2035
11.6.3. Middle East & Africa Automated Cell Therapy Manufacturing Platforms Market Revenue by Platform Architecture, 2022–2035
11.6.4. Middle East & Africa Automated Cell Therapy Manufacturing Platforms Market Revenue by Manufacturing Unit Operation, 2022–2035
11.6.5. Middle East & Africa Automated Cell Therapy Manufacturing Platforms Market Revenue by Therapy Modality, 2022–2035
11.6.6. Middle East & Africa Automated Cell Therapy Manufacturing Platforms Market Revenue by Therapy Sourcing Model, 2022–2035
11.6.7. Middle East & Africa Automated Cell Therapy Manufacturing Platforms Market Revenue by End User, 2022–2035
Chapter 12. Competitive Landscape
12.1. Key Strategic Developments (Product Launches, Partnerships, Acquisitions, Manufacturing Collaborations, and Technology Investments)
12.2. Market Share Analysis, 2026
12.3. Company Profiles
12.3.1. Octane Medical Group
12.3.2. Miltenyi Biotec
12.3.3. Cellares
12.3.4. Ori Biotech
12.3.5. Cytiva
12.3.6. Terumo BCT
12.3.7. Thermo Fisher Scientific
12.3.8. Sartorius
12.3.9. Wilson Wolf / ScaleReady
12.3.10. Adva Biotechnology
12.3.11. Multiply Labs
12.3.12. Fresenius Kabi
12.3.13. Cellular Origins
12.3.14. MaxCyte
12.3.15. Cellino Biotech
12.3.16. Applied Cells
12.3.17. Sinfonia Technology
12.3.18. Celltrio
12.3.19. Cellistic
12.3.20. CellFE
Research Design and Approach
This study employed a multi-step, mixed-method research approach that integrates:
- Secondary research
- Primary research
- Data triangulation
- Hybrid top-down and bottom-up modelling
- Forecasting and scenario analysis
This approach ensures a balanced and validated understanding of both macro- and micro-level market factors influencing the market.
Secondary Research
Secondary research for this study involved the collection, review, and analysis of publicly available and paid data sources to build the initial fact base, understand historical market behaviour, identify data gaps, and refine the hypotheses for primary research.
Sources Consulted
Secondary data for the market study was gathered from multiple credible sources, including:
- Government databases, regulatory bodies, and public institutions
- International organizations (WHO, OECD, IMF, World Bank, etc.)
- Commercial and paid databases
- Industry associations, trade publications, and technical journals
- Company annual reports, investor presentations, press releases, and SEC filings
- Academic research papers, patents, and scientific literature
- Previous market research publications and syndicated reports
These sources were used to compile historical data, market volumes/prices, industry trends, technological developments, and competitive insights.
Primary Research
Primary research was conducted to validate secondary data, understand real-time market dynamics, capture price points and adoption trends, and verify the assumptions used in the market modelling.
Stakeholders Interviewed
Primary interviews for this study involved:
- Manufacturers and suppliers in the market value chain
- Distributors, channel partners, and integrators
- End-users / customers (e.g., hospitals, labs, enterprises, consumers, etc., depending on the market)
- Industry experts, technology specialists, consultants, and regulatory professionals
- Senior executives (CEOs, CTOs, VPs, Directors) and product managers
Interview Process
Interviews were conducted via:
- Structured and semi-structured questionnaires
- Telephonic and video interactions
- Email correspondences
- Expert consultation sessions
Primary insights were incorporated into demand modelling, pricing analysis, technology evaluation, and market share estimation.
Data Processing, Normalization, and Validation
All collected data were processed and normalized to ensure consistency and comparability across regions and time frames.
The data validation process included:
- Standardization of units (currency conversions, volume units, inflation adjustments)
- Cross-verification of data points across multiple secondary sources
- Normalization of inconsistent datasets
- Identification and resolution of data gaps
- Outlier detection and removal through algorithmic and manual checks
- Plausibility and coherence checks across segments and geographies
This ensured that the dataset used for modelling was clean, robust, and reliable.
Market Size Estimation and Data Triangulation
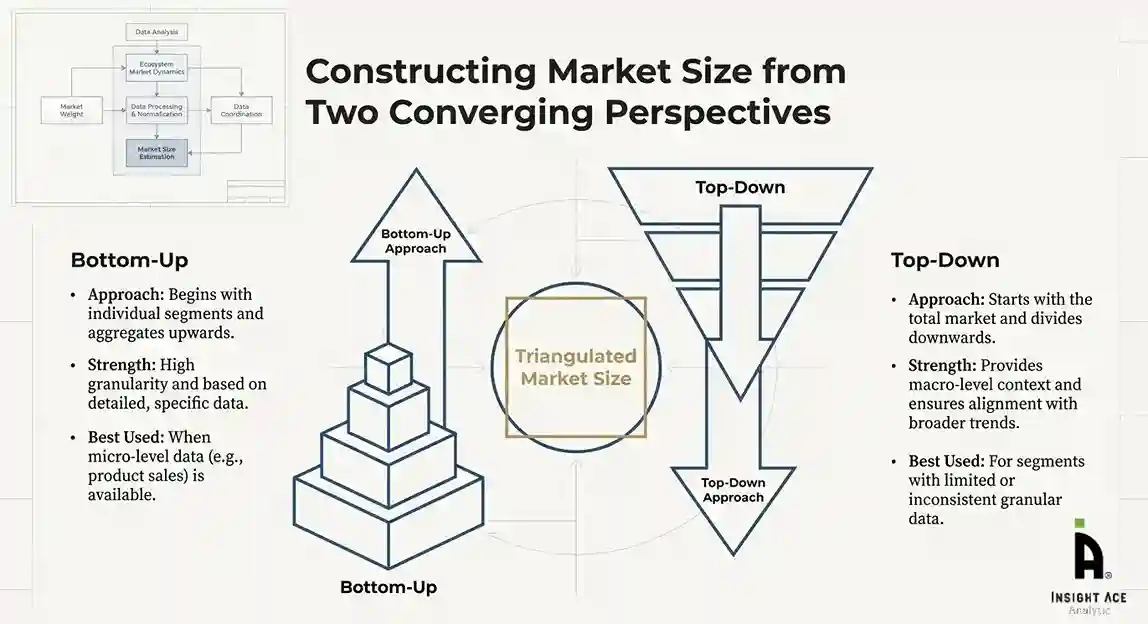
Bottom-Up Approach
The bottom-up approach involved aggregating segment-level data, such as:
- Company revenues
- Product-level sales
- Installed base/usage volumes
- Adoption and penetration rates
- Pricing analysis
This method was primarily used when detailed micro-level market data were available.
Top-Down Approach
The top-down approach used macro-level indicators:
- Parent market benchmarks
- Global/regional industry trends
- Economic indicators (GDP, demographics, spending patterns)
- Penetration and usage ratios
This approach was used for segments where granular data were limited or inconsistent.
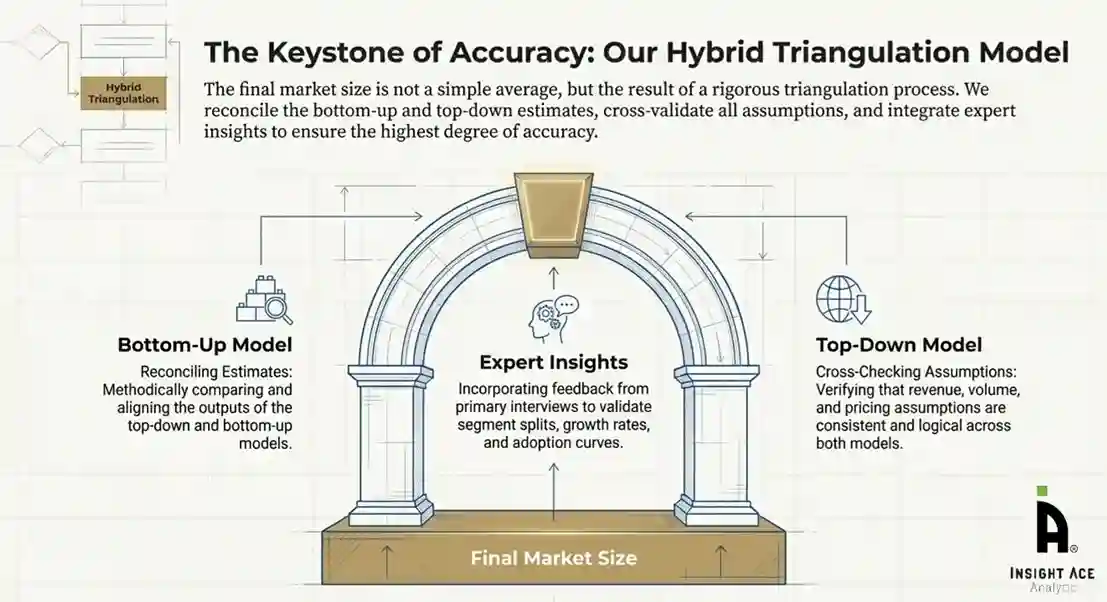
Hybrid Triangulation Approach
To ensure accuracy, a triangulated hybrid model was used. This included:
- Reconciling top-down and bottom-up estimates
- Cross-checking revenues, volumes, and pricing assumptions
- Incorporating expert insights to validate segment splits and adoption rates
This multi-angle validation yielded the final market size.
Forecasting Framework and Scenario Modelling
Market forecasts were developed using a combination of time-series modelling, adoption curve analysis, and driver-based forecasting tools.
Forecasting Methods
- Time-series modelling
- S-curve and diffusion models (for emerging technologies)
- Driver-based forecasting (GDP, disposable income, adoption rates, regulatory changes)
- Price elasticity models
- Market maturity and lifecycle-based projections
Scenario Analysis
Given inherent uncertainties, three scenarios were constructed:
- Base-Case Scenario: Expected trajectory under current conditions
- Optimistic Scenario: High adoption, favourable regulation, strong economic tailwinds
- Conservative Scenario: Slow adoption, regulatory delays, economic constraints
Sensitivity testing was conducted on key variables, including pricing, demand elasticity, and regional adoption.
Request Customization
Add countries, segments, company profiles, or extend forecast — free 10% customization with purchase.
Customize This Report →Enquire Before Buying
Speak with our analyst team about scope, methodology, pricing, or deliverable formats.
Enquire Now →Frequently Asked Questions
Automated Cell Therapy Manufacturing Platforms Market is estimated tog grow at a 19.5% CAGR during the forecast period for 2026 to 2035.
Octane Medical Group, Miltenyi Biotec, Cellares, Ori Biotech, Cytiva, Terumo BCT, Thermo Fisher Scientific, Sartorius, Wilson Wolf / ScaleReady, Adva Biotechnology, Multiply Labs, Fresenius Kabi, Cellular Origins, MaxCyte, Cellino Biotech
Automated Cell Therapy Manufacturing Platforms Market is segmented into Offering, Platform Architecture, Manufacturing Unit Operation, Therapy Modality, Therapy Sourcing Model and By Region.
North America region is leading the Automated Cell Therapy Manufacturing Platforms Market.