Natural Gas Market Size, Share, Trend, Scope Report 2026 to 2035
What is Natural Gas Market Size?
Global Natural Gas Market Size is valued at USD 2072.86 Bn in 2025 and is predicted to reach USD 2,798.33 Bn by the year 2035 at an 3.2% CAGR during the forecast period for 2026 to 2035.
Natural Gas Market Size, Share & Trends Analysis by Application (Po11wer Generation, Industrial Heating, Residential Heating, Transportation, Chemical Feedstock), by Market Structure (Wholesale Market, Retail Market, Spot Market), by Distribution Method (Pipeline Distribution, LNG Shipping, CNG Transport), by Type of Natural Gas (Conventional Natural Gas, Unconventional Natural Gas, Liquefied Natural Gas (LNG), Compressed Natural Gas (CNG)), by End Use (Commercial, Residential, Industrial, Electricity Generation) and Segment Forecasts, 2026 to 2035.
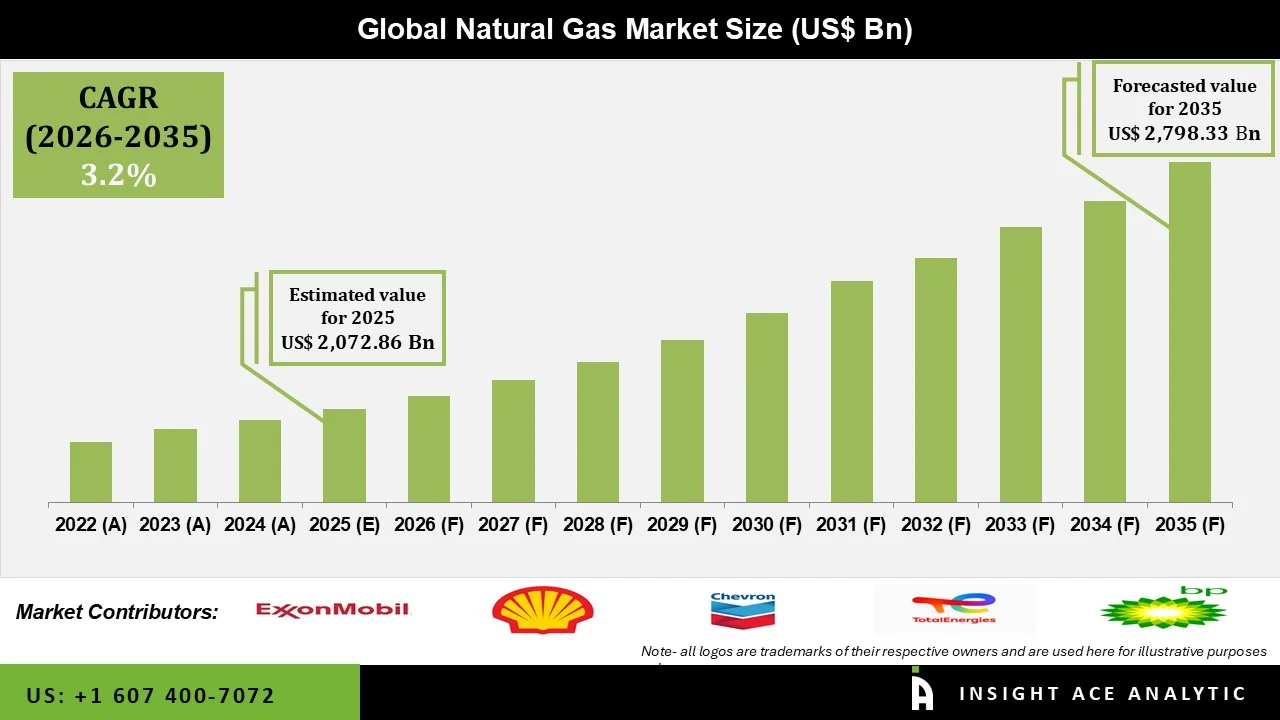
The natural gas market is an important part of the energy sector, supporting electricity generation, industrial operations, residential and commercial heating, transportation, and chemical production. Natural gas is widely used as a reliable energy source and can produce lower carbon emissions than coal when used for power generation and industrial applications. Rising energy demand, urbanisation, industrial development, and the expansion of gas-based power generation are supporting demand for natural gas across different markets. Natural gas also continues to play a role in energy security and the transition to lower-carbon energy systems, particularly where renewable energy is expanding but flexible, reliable energy sources are still required. The natural gas market covers both conventional and unconventional gas, as well as gas delivered by pipelines or traded as liquefied natural gas (LNG) and compressed natural gas (CNG). LNG is becoming more important because it lets gas reach places that pipelines cannot. Building LNG plants, storage, and transport networks is making gas supply and trade more flexible. Pipelines are still a main way to deliver gas to power plants, factories, businesses, and homes. CNG is used in transport and other areas where compressed gas is a practical fuel.
Demand for natural gas depends on how and where it is used. Power generation is a major use, especially in places that need flexible energy to support renewables. Industries use natural gas for heating, making steam, running factories, and as a raw material for chemicals and other products. Homes and businesses use it for heating, cooking, and other energy needs. In transport, CNG and LNG are used in some vehicles and heavy-duty trucks, as part of efforts to save fuel and cut emissions from traditional fuels. Changes influence market development in natural gas infrastructure, pricing, supply availability, and international trade. Investments in exploration and production, pipeline networks, LNG terminals, storage facilities, and transportation infrastructure are helping expand access to natural gas. The development of LNG trade is also strengthening connections between gas-producing and gas-consuming markets. Wholesale and spot markets play an important role in determining natural gas prices and improving supply flexibility. However, natural gas prices can be affected by supply and demand changes, weather conditions, production levels, geopolitical developments, and energy policies.
Technological developments are further influencing the natural gas industry. Advances in exploration, drilling, production, gas processing, pipeline monitoring, LNG infrastructure, and digital asset management are helping companies improve operational efficiency and manage resources more effectively. Digital technologies, automation, data analytics, and remote monitoring are increasingly being used across natural gas operations to improve asset performance, identify potential issues, reduce downtime, and support safer operations. These technologies are particularly relevant for production facilities, pipelines, LNG terminals, storage facilities, and other infrastructure that requires continuous monitoring and maintenance. Despite its growth opportunities, the natural gas market faces several challenges. Environmental concerns, methane emissions, regulatory requirements, commodity price fluctuations, and the transition toward renewable and low-carbon energy sources can influence market development. Infrastructure limitations can also restrict natural gas availability in certain areas, particularly where pipeline networks, LNG terminals, or storage facilities are limited. In addition, significant capital requirements for exploration, production, transportation, and LNG infrastructure can create financial and operational challenges for market participants. Changes in government policies and energy regulations may further influence investment decisions and long-term demand.
Overall, the natural gas market is expected to remain an important part of the energy sector throughout the forecast period. Continued demand from power generation, industrial applications, residential and commercial users, transportation, and chemical production is expected to support market development. The expansion of LNG trade, pipeline infrastructure, gas-based power generation, and technological improvements is likely to create additional opportunities for market participants. At the same time, the industry will need to address environmental concerns, supply security, price volatility, and the ongoing transition toward cleaner energy sources. As energy markets balance reliability, affordability, and emissions-reduction objectives, natural gas is expected to continue playing an important role in the evolving energy mix.
Competitive Landscape
Which are the Leading Players in Natural Gas Market ?
- ExxonMobil
- Royal Dutch Shell
- Chevron
- TotalEnergies
- BP
- Eni
- ConocoPhillips
- Equinor
- Petrobras
Driver
Growing Demand for Natural Gas Across Power Generation, Industrial and Residential Applications is Driving the Natural Gas Market
Natural gas is being used more in power generation, industrial heating, residential heating, transportation, and as a chemical feedstock, which is helping the natural gas market grow. It is a popular energy source because it is flexible, produces less carbon than coal and oil in many cases, and can provide a steady energy supply. As electricity demand rises and more areas become industrialized and urbanized, the use of natural gas continues to increase. Power generation is a key reason for the growing demand for natural gas, especially as utilities look for flexible options to work alongside renewable energy. Gas-fired power plants help keep electricity systems stable when renewable sources like wind and solar fluctuate. Industries use natural gas for heating, making steam, running manufacturing processes, and producing chemicals. In homes and businesses, it is commonly used for heating, cooking, and other energy needs. Transportation also adds to natural gas demand, with compressed natural gas (CNG) and liquefied natural gas (LNG) used in some passenger, commercial, and heavy-duty vehicles. Natural gas is also a key ingredient in making chemicals, fertilizers, hydrogen, and other industrial products. More investment in pipelines, LNG terminals, storage, processing plants, and transport networks is making supply more available and helping the market grow. As the need for reliable energy, industrial growth, and energy security rises, demand for natural gas is likely to keep increasing.
Restraint/Challenge
Price Volatility, Environmental Concerns and High Infrastructure Costs Can Limit Natural Gas Market Expansion
Price volatility and the high cost of developing natural gas infrastructure remain important challenges for the natural gas market. Several factors can influence natural gas prices, including production, consumption, weather conditions, storage levels, geopolitical developments, international trade, and energy policies. Significant price fluctuations can affect the profitability of producers, utilities, industrial consumers, and other market participants and can make long-term investment planning more difficult. Building natural gas infrastructure takes a lot of money and time. Pipelines, LNG plants, storage, processing facilities, and transport systems all need big investments and can take years to complete.
In areas without enough infrastructure, the lack of pipelines or LNG facilities can make it hard to access natural gas and slow down market growth. Environmental issues are another challenge. Methane leaks during natural gas production, processing, transport, and distribution are getting more attention because methane is a strong greenhouse gas. Governments are setting stricter rules and emissions standards, which means companies have to meet tougher requirements. Also, as more renewable energy is used and efforts to cut back on fossil fuels grow, demand for natural gas could drop in some areas. To tackle these challenges, natural gas companies are working to make production more efficient, cut methane emissions, update pipelines, improve LNG technology, and use digital monitoring. Investing in better infrastructure, managing the environment well, diversifying supply, and improving gas transport will help the market keep growing.
Power Generation Segment is Expected to Account for a Significant Share of the Natural Gas Market
Power generation is expected to make up a large part of the natural gas market as electricity demand grows and energy systems need flexible, reliable sources. Gas-fired power plants are popular because they can provide steady electricity and quickly adjust to changes in demand. This flexibility is especially important as more solar and wind power are added to the grid. Utilities and power companies are using more natural gas-fired plants to keep the grid stable and support renewables like wind and solar. Combined-cycle gas turbines are efficient and help meet rising power needs in many markets. Natural gas is also widely used for industrial heating, with manufacturers relying on it for boilers, furnaces, kilns, and drying systems. In places with good gas networks, it is still important for home heating, cooking, and water heating. CNG and LNG are used as alternative fuels for some vehicles, and the chemical industry uses natural gas to make products like ammonia, methanol, and hydrogen. Ongoing demand in all these areas is expected to help the natural gas market grow.
Wholesale and Spot Markets are Expected to Account for a Significant Share of the Natural Gas Market
The wholesale, retail, and spot market segments play an important role in the natural gas market by connecting producers, suppliers, utilities, industrial consumers, and other market participants. Wholesale markets allow large quantities of natural gas to be traded between producers, distributors, utilities, and commercial buyers. These markets support large-scale supply arrangements and help participants manage their energy requirements. Retail markets serve residential, commercial, and smaller industrial consumers through gas distribution networks and energy suppliers. Residential consumption, heating requirements, commercial activities, and local energy infrastructure influence demand in retail markets. Spot markets allow natural gas to be bought and sold for shorter-term delivery and can improve supply flexibility during periods of changing demand or supply conditions. The development of LNG trade and interconnected pipeline systems is increasing the flexibility of natural gas markets by allowing suppliers and buyers to access different gas sources. Improvements in market infrastructure, trading platforms, storage facilities, and transportation networks further support the growth of wholesale and spot trading. However, market participants continue to manage challenges related to price volatility, supply availability, seasonal demand, and geopolitical conditions.
Why North America Led the Natural Gas Market?
North America represents a major region in the natural gas market, supported by substantial natural gas production, extensive pipeline infrastructure, LNG development, established energy markets, and strong demand from power generation and industrial applications. The United States accounts for a significant share of regional natural gas activity, supported by extensive production capabilities and a well-developed network of pipelines, processing facilities, storage infrastructure, and LNG export terminals.
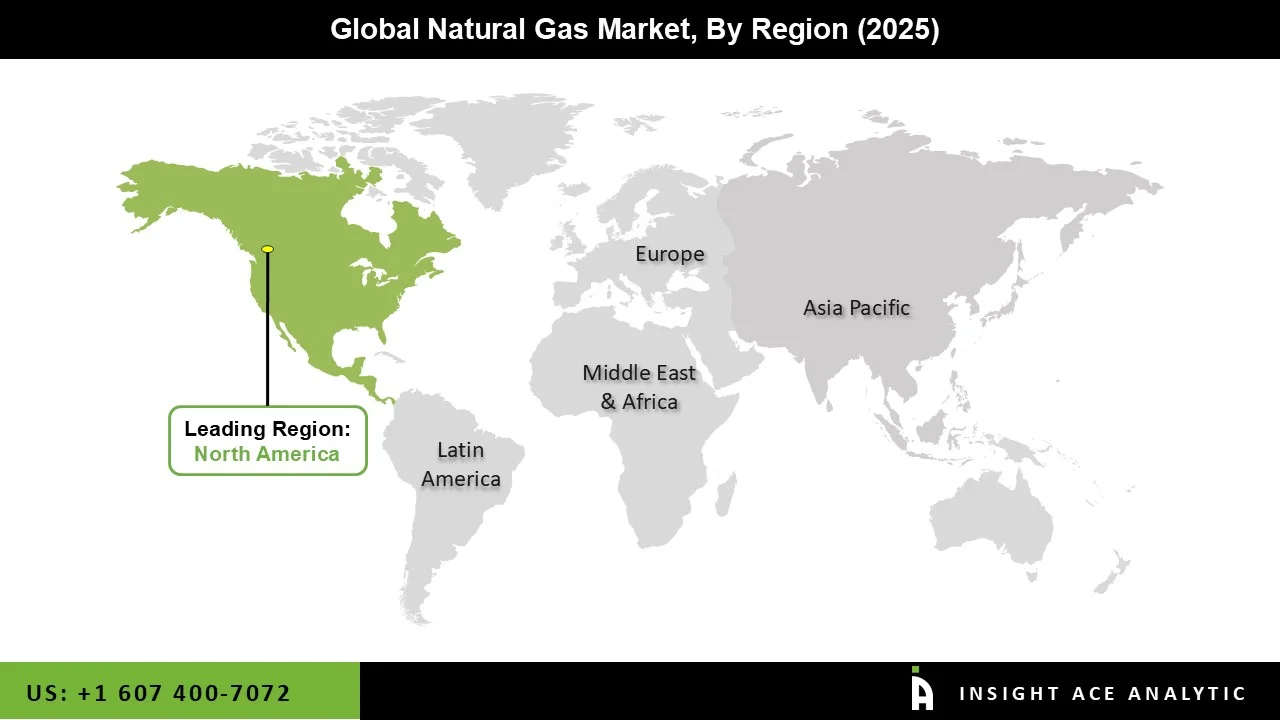
Natural gas is widely used for electricity generation, industrial operations, residential heating, commercial applications, and chemical production across the region. Growth in gas-fired power generation has also been supported by rising electricity demand and the need for flexible generation capacity. In addition, LNG export infrastructure development has strengthened the region’s role in international natural gas trade by enabling producers to supply overseas markets.
Key Developments
- In May 2026, Chevron continued investing in natural gas and LNG production, infrastructure, and international gas projects. The company has focused on expanding reliable natural gas supply while improving operational efficiency and supporting its integrated energy portfolio.
- In July 2026, BP continued developing its natural gas and LNG portfolio while focusing on production efficiency, supply optimisation, and integrated gas trading. The company has been investing in gas projects and infrastructure to support energy demand while improving the efficiency and environmental performance of its operations.
Natural Gas Market Report Scope :
| Report Attribute | Specifications |
| Market size value in 2025 | USD 1,072.86 Bn |
| Revenue forecast in 2035 | USD 2,798.33 Bn |
| Growth Rate CAGR | CAGR of 3.2% from 2026 to 2035 |
| Quantitative Units | Representation of revenue in US$ Bn and CAGR from 2026 to 2035 |
| Historic Year | 2021 to 2025 |
| Forecast Year | 2026-2035 |
| Report Coverage | The forecast of revenue, the position of the company, the competitive market structure, growth prospects, and trends |
| Segments Covered | Application, Market Structure, Type of Natural Gas, Distribution Method, End User and By Region |
| Regional Scope | North America; Europe; Asia Pacific; Latin America; Middle East & Africa |
| Country Scope | U.S.; Canada; U.K.; Germany; China; India; Japan; Brazil; Mexico; The UK; France; Italy; Spain; China; Japan; India; South Korea; Southeast Asia; South Korea; Southeast Asia |
| Competitive Landscape | ExxonMobil, Royal Dutch Shell, Chevron, TotalEnergies, BP, Eni, ConocoPhillips, Equinor, Petrobras |
| Customization Scope | Free customisation report with the procurement of the report, Modifications to the regional and segment scope. Geographic competitive landscape. |
| Pricing and Available Payment Methods | Explore pricing alternatives that are customised to your particular study requirements. |
Segmentations Natural Gas Market:
Natural Gas Market by Application -
- Power Generation
- Industrial Heating
- Residential Heating
- Transportation
- Chemical Feedstock
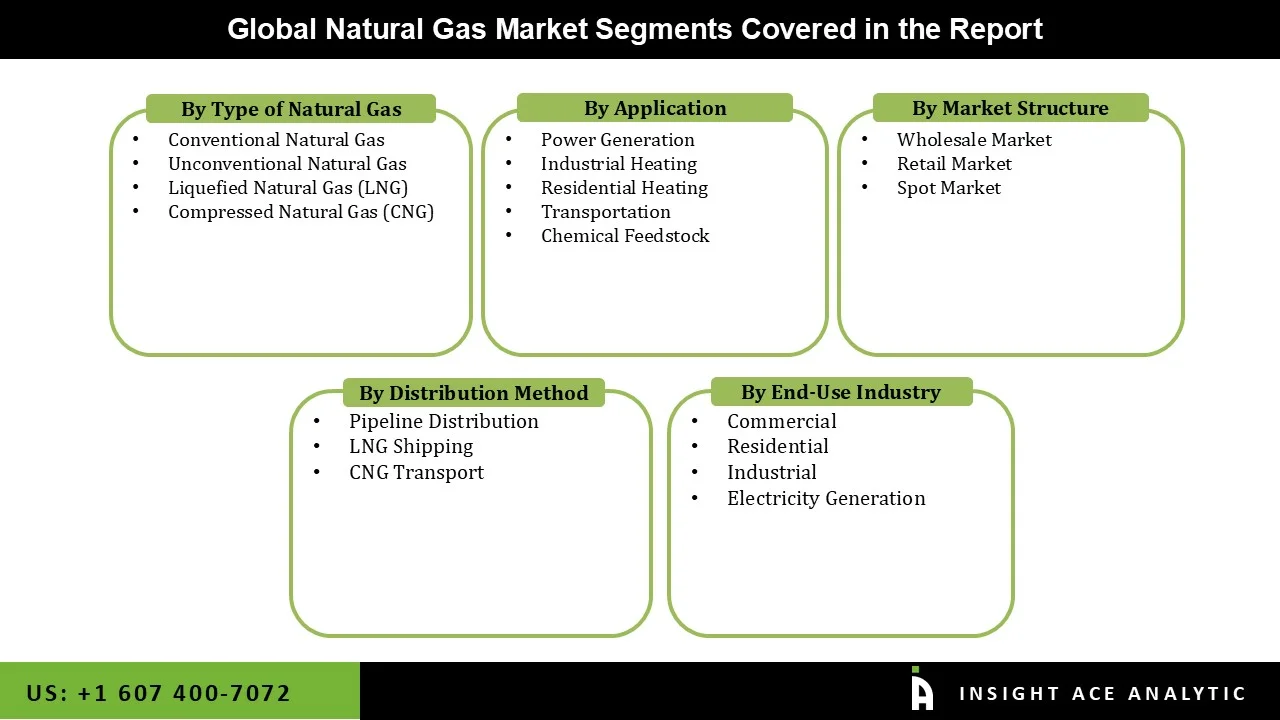
Natural Gas Market by Market Structure -
- Wholesale Market
- Retail Market
- Spot Market
Natural Gas Market by Type of Natural gas -
- Conventional Natural Gas
- Unconventional Natural Gas
- Liquefied Natural Gas (LNG)
- Compressed Natural Gas (CNG)
Natural Gas Market by Distribution Method -
- Pipeline Distribution
- LNG Shipping
- CNG Transport
Natural Gas Market by End User -
- Commercial
- Residential
- Industrial
- Electricity Generation
Natural Gas Market by Region-
- North America-
- The US
- Canada
- Europe-
- Germany
- The UK
- France
- Italy
- Spain
- Rest of Europe
- Asia-Pacific-
- China
- Japan
- India
- South Korea
- South East Asia
- Rest of Asia Pacific
- Latin America-
- Brazil
- Argentina
- Mexico
- Rest of Latin America
- Middle East and Africa-
- GCC Countries
- South Africa
- Rest of Middle East and Africa
Research Design and Approach
This study employed a multi-step, mixed-method research approach that integrates:
- Secondary research
- Primary research
- Data triangulation
- Hybrid top-down and bottom-up modelling
- Forecasting and scenario analysis
This approach ensures a balanced and validated understanding of both macro- and micro-level market factors influencing the market.
Secondary Research
Secondary research for this study involved the collection, review, and analysis of publicly available and paid data sources to build the initial fact base, understand historical market behaviour, identify data gaps, and refine the hypotheses for primary research.
Sources Consulted
Secondary data for the market study was gathered from multiple credible sources, including:
- Government databases, regulatory bodies, and public institutions
- International organizations (WHO, OECD, IMF, World Bank, etc.)
- Commercial and paid databases
- Industry associations, trade publications, and technical journals
- Company annual reports, investor presentations, press releases, and SEC filings
- Academic research papers, patents, and scientific literature
- Previous market research publications and syndicated reports
These sources were used to compile historical data, market volumes/prices, industry trends, technological developments, and competitive insights.

Primary Research
Primary research was conducted to validate secondary data, understand real-time market dynamics, capture price points and adoption trends, and verify the assumptions used in the market modelling.
Stakeholders Interviewed
Primary interviews for this study involved:
- Manufacturers and suppliers in the market value chain
- Distributors, channel partners, and integrators
- End-users / customers (e.g., hospitals, labs, enterprises, consumers, etc., depending on the market)
- Industry experts, technology specialists, consultants, and regulatory professionals
- Senior executives (CEOs, CTOs, VPs, Directors) and product managers
Interview Process
Interviews were conducted via:
- Structured and semi-structured questionnaires
- Telephonic and video interactions
- Email correspondences
- Expert consultation sessions
Primary insights were incorporated into demand modelling, pricing analysis, technology evaluation, and market share estimation.
Data Processing, Normalization, and Validation
All collected data were processed and normalized to ensure consistency and comparability across regions and time frames.
The data validation process included:
- Standardization of units (currency conversions, volume units, inflation adjustments)
- Cross-verification of data points across multiple secondary sources
- Normalization of inconsistent datasets
- Identification and resolution of data gaps
- Outlier detection and removal through algorithmic and manual checks
- Plausibility and coherence checks across segments and geographies
This ensured that the dataset used for modelling was clean, robust, and reliable.
Market Size Estimation and Data Triangulation
Bottom-Up Approach
The bottom-up approach involved aggregating segment-level data, such as:
- Company revenues
- Product-level sales
- Installed base/usage volumes
- Adoption and penetration rates
- Pricing analysis
This method was primarily used when detailed micro-level market data were available.

Top-Down Approach
The top-down approach used macro-level indicators:
- Parent market benchmarks
- Global/regional industry trends
- Economic indicators (GDP, demographics, spending patterns)
- Penetration and usage ratios
This approach was used for segments where granular data were limited or inconsistent.
Hybrid Triangulation Approach
To ensure accuracy, a triangulated hybrid model was used. This included:
- Reconciling top-down and bottom-up estimates
- Cross-checking revenues, volumes, and pricing assumptions
- Incorporating expert insights to validate segment splits and adoption rates
This multi-angle validation yielded the final market size.
Forecasting Framework and Scenario Modelling
Market forecasts were developed using a combination of time-series modelling, adoption curve analysis, and driver-based forecasting tools.
Forecasting Methods
- Time-series modelling
- S-curve and diffusion models (for emerging technologies)
- Driver-based forecasting (GDP, disposable income, adoption rates, regulatory changes)
- Price elasticity models
- Market maturity and lifecycle-based projections
Scenario Analysis
Given inherent uncertainties, three scenarios were constructed:
- Base-Case Scenario: Expected trajectory under current conditions
- Optimistic Scenario: High adoption, favourable regulation, strong economic tailwinds
- Conservative Scenario: Slow adoption, regulatory delays, economic constraints
Sensitivity testing was conducted on key variables, including pricing, demand elasticity, and regional adoption.
Request Customization
Add countries, segments, company profiles, or extend forecast — free 10% customization with purchase.
Customize This Report →Enquire Before Buying
Speak with our analyst team about scope, methodology, pricing, or deliverable formats.
Enquire Now →Frequently Asked Questions
Natural Gas Market Size is valued at USD 2072.86 Bn in 2025 and is predicted to reach USD 2,798.33 Bn by the year 2035
The Natural Gas Market is expected to grow at a 3.2% CAGR during the forecast period for 2026 to 2035
ExxonMobil, Royal Dutch Shell, Chevron, TotalEnergies, BP, Eni, ConocoPhillips, Equinor, Petrobras and Others.
Natural Gas Market is segmented into Application, Market Structure, Type of Natural Gas, Distribution Method, End User and Other.
North America region is leading the Natural Gas Market.