Hyper Personalization Market Size, Share, Scope Report 2026 to 2035
What is Hyper Personalization Market Size?
Hyper Personalization Market Size is valued at USD 18.99 Bn in 2025 and is predicted to reach USD 108.09 Bn by the year 2035 at a 19.2 CAGR during the forecast period for 2026 to 2035.
Hyper Personalization Market Size, Share & Trends Analysis Distribution by Component (Software, Services), By Deployment (On-premise, Cloud-based, Hybrid), By Technology (AI and ML, Natural Language Processing (NLP), Big Data Analytics, Predictive Analytics), By Industry (BFSI, IT & Telecom, Retail, Manufacturing, Healthcare, Others (Education, Travel & Hospitality, etc.)) and Segment Forecasts, 2026 to 2035
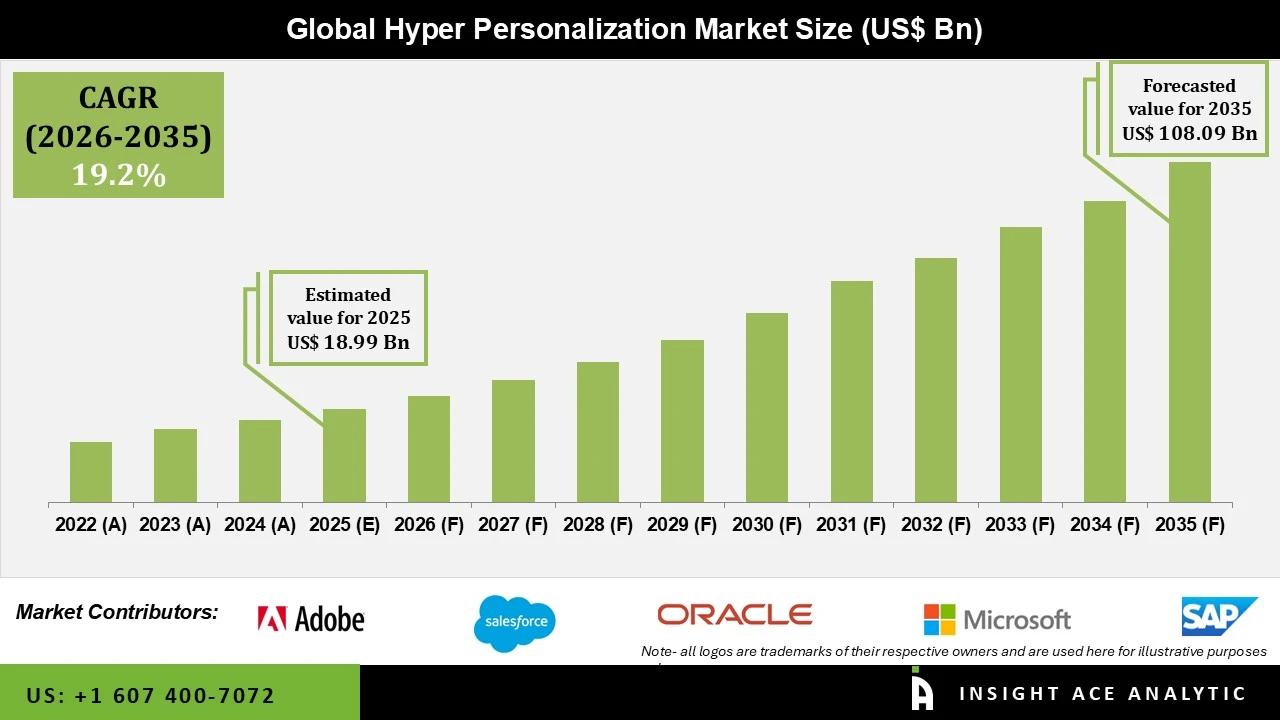
Hyper-personalization is the use of artificial intelligence (AI), machine learning, customer data, behavioral analytics, and real-time insights to create highly personalized experiences, content, products, offers, and communications for customers. Unlike traditional personalization, which usually relies on broad customer segments or basic demographic information, hyper-personalization looks at individual-level data. This data includes browsing behavior, purchase history, preferences, location, and real-time interactions to customize customer experiences. Companies increasingly apply it in marketing, e-commerce, retail, financial services, healthcare, media, and other fields to boost customer engagement and conversion.
The hyper-personalization market includes technologies, platforms, software, and services that help businesses collect, analyze, and use customer data to provide tailored experiences across digital and physical touchpoints. The market features solutions like AI-driven recommendation engines, customer data platforms (CDPs), predictive analytics, personalized content, targeted marketing automation, and real-time customer engagement tools. The growing use of AI and machine learning, more access to customer data, expansion of digital channels, and the demand for more relevant customer experiences are driving market growth. Major players in this space include Adobe, Salesforce, Oracle, Microsoft, SAP, IBM, Amazon Web Services, Twilio Segment, Braze, Dynamic Yield, Google, and SAS Institute.
Competitive Landscape
Which are the Leading Players in the Hyper Personalization Market?
• Adobe Inc.
• Salesforce, Inc.
• Oracle Corporation
• Microsoft Corporation
• SAP SE
• IBM Corporation
• Amazon Web Services (AWS)
• Twilio Segment
• Braze Inc.
• Dynamic Yield
• PepsiCo Ltd.
• Google LLC
• SAS Institute Inc.
Market Dynamics
Driver
Increasing Adoption of AI and Machine Learning
The growing use of artificial intelligence (AI) and machine learning (ML) is a key factor in the Hyper-Personalization Market. AI and ML tools help businesses look at large amounts of customer data, such as browsing habits, purchase history, preferences, and real-time interactions. This helps them understand what individual customers need and anticipate their preferences. As a result, companies can offer personalized product recommendations, targeted deals, tailored content, and real-time communication. As businesses work to boost customer engagement, conversion rates, and retention, the need for AI- and ML-driven hyper-personalization solutions is on the rise.
Restrain/Challenge
Data Privacy and Security Concerns
Data privacy and security concerns are a big challenge for the Hyper-Personalization Market. Hyper-personalization requires businesses to collect and analyze large amounts of customer data, which includes behavioral, transactional, and preference-based information. Growing data privacy regulations, worries about unauthorized data use, and cybersecurity risks make it harder for companies to gather and process customer information on a large scale. As a result, businesses must invest in strong data protection, manage consent effectively, and ensure compliance, which can raise costs and complicate implementation.
Hardware Support Services
Software Segment is Expected to Drive the Hyper Personalization Market
The software segment is leading the hyper-personalization market because more companies are using AI-powered personalization platforms, customer data platforms (CDPs), analytics tools, recommendation engines, and marketing automation software. These solutions help businesses understand customer behavior and provide tailored content, offers, recommendations, and experiences in real time. They also offer scalability and automation across various customer interactions.
Cloud-based Segment is Growing at the Highest Rate in the Hyper Personalization Market
The Cloud-based segment is expected to grow at the highest rate in the hyper-personalization market, driven by the increasing adoption of cloud-based AI, machine learning, customer data platforms, and analytics solutions. Cloud deployment enables businesses to process large volumes of customer data in real time, scale personalization capabilities efficiently, reduce infrastructure costs, and integrate personalization tools across multiple digital channels.
Why North America Led the Hyper Personalization Market?
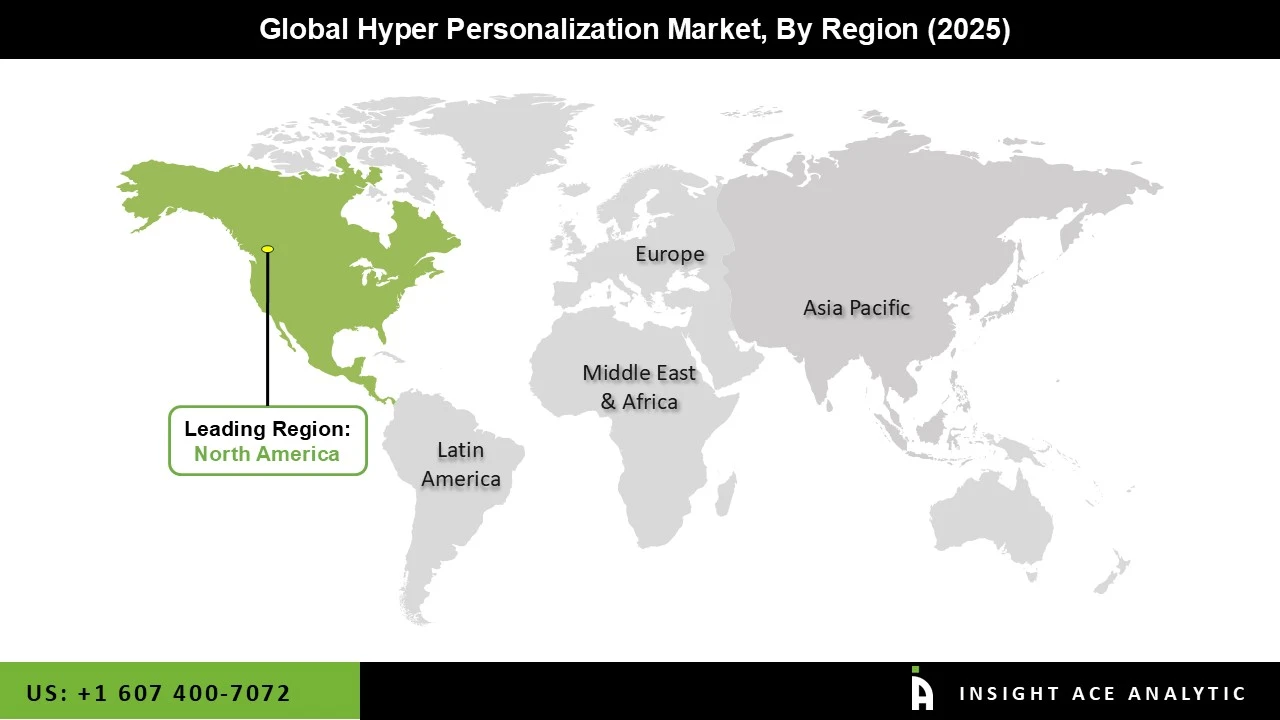
North America leads the hyper-personalization market because of its strong technology infrastructure and early use of artificial intelligence (AI), machine learning, cloud computing, and data analytics. The region has a mature digital ecosystem and many technology providers that offer customer data platforms, marketing automation, AI-powered recommendation engines, and personalization solutions. Additionally, businesses in retail, e-commerce, financial services, healthcare, media, and telecommunications are increasingly using customer data to provide tailored content, product recommendations, and real-time offers. The presence of major technology companies like Adobe, Salesforce, Microsoft, IBM, Oracle, and Google also boosts the regional market. High consumer expectations for smooth and relevant digital experiences, along with rising investments in AI-driven customer engagement, continue to support North America's position as a leader.
Key Development
• March 2026: Adobe and NVIDIA partnered to accelerate AI-powered creation, production, and personalization, combining Adobe’s creative and marketing technologies with NVIDIA’s AI models and computing capabilities to develop next-generation Firefly models and agentic workflows.
Hyper Personalization Market Report Scope:
| Report Attribute | Specifications |
| Market size value in 2025 | USD 18.99 Bn |
| Revenue forecast in 2035 | USD 108.09 Bn |
| Growth Rate CAGR | CAGR of 19.2% from 2026 to 2035 |
| Quantitative Units | Representation of revenue in US$ Bn and CAGR from 2026 to 2035 |
| Historic Year | 2022 to 2025 |
| Forecast Year | 2026-2035 |
| Report Coverage | The forecast of revenue, the position of the company, the competitive market structure, growth prospects, and trends |
| Segments Covered | Component, Deployment, Technology, Industry and By Region |
| Regional Scope | North America; Europe; Asia Pacific; Latin America; Middle East & Africa |
| Country Scope | U.S.; Canada; U.K.; Germany; China; India; Japan; Brazil; Mexico; The UK; France; Italy; Spain; China; Japan; India; South Korea; Southeast Asia; South Korea; Southeast Asia |
| Competitive Landscape | Adobe Inc. Salesforce, Inc. Oracle Corporation Microsoft Corporation SAP SE, IBM Corporation, Amazon Web Services (AWS), Twilio Segment, Braze Inc., Dynamic Yield, PepsiCo Ltd., Google LLC, SAS Institute Inc. |
| Customization Scope | Free customization report with the procurement of the report, Modifications to the regional and segment scope. Geographic competitive landscape. |
| Pricing and Available Payment Methods | Explore pricing alternatives that are customized to your particular study requirements. |
Market Segmentation:
Hyper Personalization Market by Component -
• Software
• Services
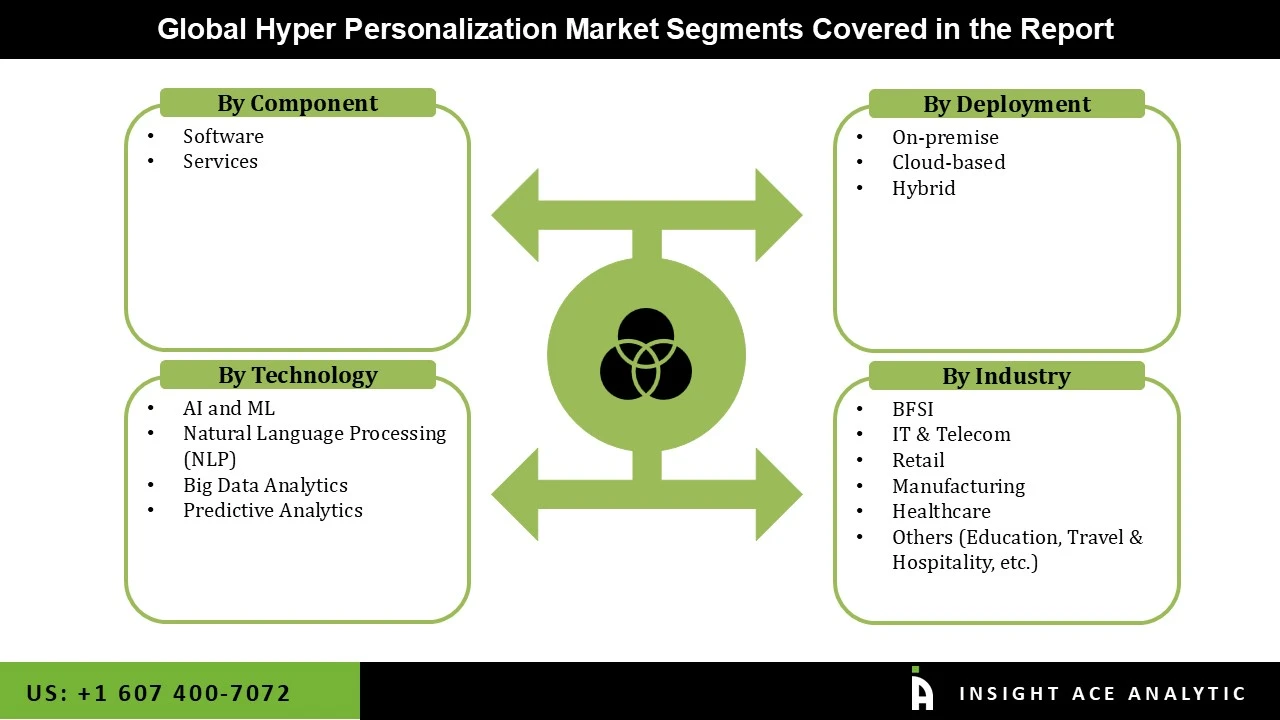
Hyper Personalization Market by Deployment -
• On-premise
• Cloud-based
• Hybrid
Hyper Personalization Market by Technology -
• AI and ML
• Natural Language Processing (NLP)
• Big Data Analytics
• Predictive Analytics
Hyper Personalization Market by Industry -
• BFSI
• IT & Telecom
• Retail
• Manufacturing
• Healthcare
• Others (Education, Travel & Hospitality, etc.)
Hyper Personalization Market by Region-
North America-
• The US
• Canada
• Mexico
Europe-
• Germany
• The UK
• France
• Italy
• Spain
• Rest of Europe
Asia-Pacific-
• China
• Japan
• India
• South Korea
• South East Asia
• Rest of Asia Pacific
Latin America-
• Brazil
• Argentina
• Rest of Latin America
Middle East & Africa-
• GCC Countries
• South Africa
• Rest of Middle East and Africa
Research Design and Approach
This study employed a multi-step, mixed-method research approach that integrates:
- Secondary research
- Primary research
- Data triangulation
- Hybrid top-down and bottom-up modelling
- Forecasting and scenario analysis
This approach ensures a balanced and validated understanding of both macro- and micro-level market factors influencing the market.
Secondary Research
Secondary research for this study involved the collection, review, and analysis of publicly available and paid data sources to build the initial fact base, understand historical market behaviour, identify data gaps, and refine the hypotheses for primary research.
Sources Consulted
Secondary data for the market study was gathered from multiple credible sources, including:
- Government databases, regulatory bodies, and public institutions
- International organizations (WHO, OECD, IMF, World Bank, etc.)
- Commercial and paid databases
- Industry associations, trade publications, and technical journals
- Company annual reports, investor presentations, press releases, and SEC filings
- Academic research papers, patents, and scientific literature
- Previous market research publications and syndicated reports
These sources were used to compile historical data, market volumes/prices, industry trends, technological developments, and competitive insights.
Primary Research
Primary research was conducted to validate secondary data, understand real-time market dynamics, capture price points and adoption trends, and verify the assumptions used in the market modelling.
Stakeholders Interviewed
Primary interviews for this study involved:
- Manufacturers and suppliers in the market value chain
- Distributors, channel partners, and integrators
- End-users / customers (e.g., hospitals, labs, enterprises, consumers, etc., depending on the market)
- Industry experts, technology specialists, consultants, and regulatory professionals
- Senior executives (CEOs, CTOs, VPs, Directors) and product managers
Interview Process
Interviews were conducted via:
- Structured and semi-structured questionnaires
- Telephonic and video interactions
- Email correspondences
- Expert consultation sessions
Primary insights were incorporated into demand modelling, pricing analysis, technology evaluation, and market share estimation.
Data Processing, Normalization, and Validation
All collected data were processed and normalized to ensure consistency and comparability across regions and time frames.
The data validation process included:
- Standardization of units (currency conversions, volume units, inflation adjustments)
- Cross-verification of data points across multiple secondary sources
- Normalization of inconsistent datasets
- Identification and resolution of data gaps
- Outlier detection and removal through algorithmic and manual checks
- Plausibility and coherence checks across segments and geographies
This ensured that the dataset used for modelling was clean, robust, and reliable.
Market Size Estimation and Data Triangulation
Bottom-Up Approach
The bottom-up approach involved aggregating segment-level data, such as:
- Company revenues
- Product-level sales
- Installed base/usage volumes
- Adoption and penetration rates
- Pricing analysis
This method was primarily used when detailed micro-level market data were available.
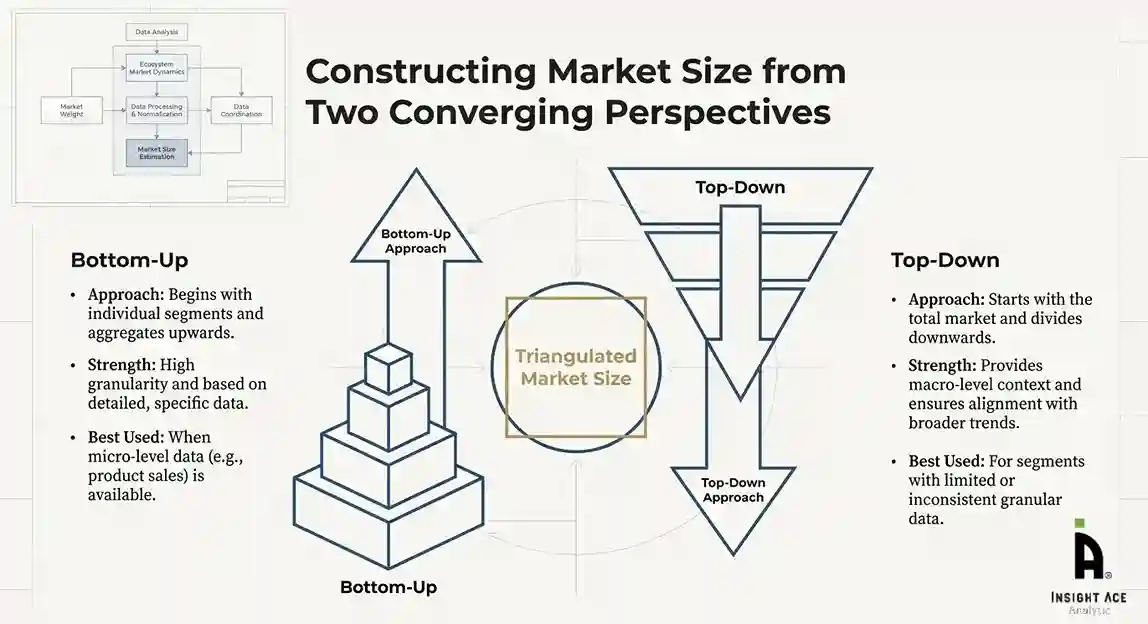
Top-Down Approach
The top-down approach used macro-level indicators:
- Parent market benchmarks
- Global/regional industry trends
- Economic indicators (GDP, demographics, spending patterns)
- Penetration and usage ratios
This approach was used for segments where granular data were limited or inconsistent.
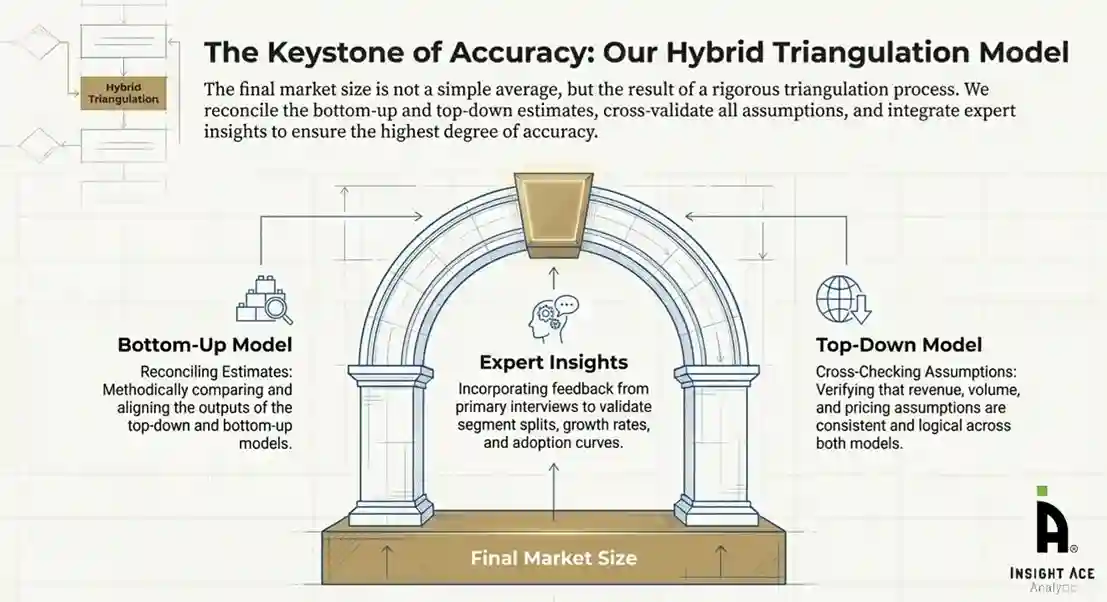
Hybrid Triangulation Approach
To ensure accuracy, a triangulated hybrid model was used. This included:
- Reconciling top-down and bottom-up estimates
- Cross-checking revenues, volumes, and pricing assumptions
- Incorporating expert insights to validate segment splits and adoption rates
This multi-angle validation yielded the final market size.
Forecasting Framework and Scenario Modelling
Market forecasts were developed using a combination of time-series modelling, adoption curve analysis, and driver-based forecasting tools.
Forecasting Methods
- Time-series modelling
- S-curve and diffusion models (for emerging technologies)
- Driver-based forecasting (GDP, disposable income, adoption rates, regulatory changes)
- Price elasticity models
- Market maturity and lifecycle-based projections
Scenario Analysis
Given inherent uncertainties, three scenarios were constructed:
- Base-Case Scenario: Expected trajectory under current conditions
- Optimistic Scenario: High adoption, favourable regulation, strong economic tailwinds
- Conservative Scenario: Slow adoption, regulatory delays, economic constraints
Sensitivity testing was conducted on key variables, including pricing, demand elasticity, and regional adoption.
Request Customization
Add countries, segments, company profiles, or extend forecast — free 10% customization with purchase.
Customize This Report →Enquire Before Buying
Speak with our analyst team about scope, methodology, pricing, or deliverable formats.
Enquire Now →Frequently Asked Questions
Hyper Personalization Market Size is valued at USD 18.99 Bn in 2025 and is predicted to reach USD 108.09 Bn by the year 2035
Hyper Personalization Market is expected to grow at a 19.2 CAGR during the forecast period for 2026 to 2035.
Adobe Inc., Salesforce, Inc., Oracle Corporation, Microsoft Corporation, SAP SE, IBM Corporation, Amazon Web Services (AWS), Twilio Segment, Braze Inc., Dynamic Yield, PepsiCo Ltd., Google LLC, SAS Institute Inc.
Hyper Personalization Market is segmented into Component, Deployment, Technology, Industry and By Region
North America region is leading the Hyper Personalization Market.