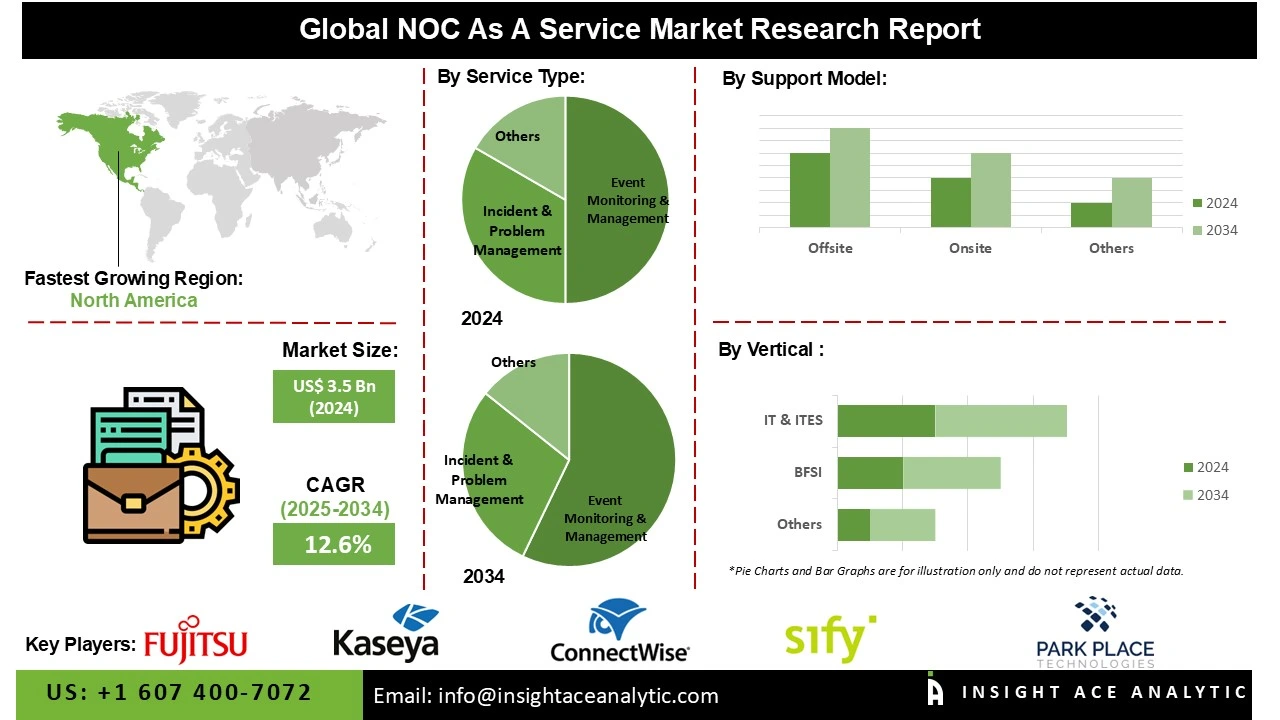
NOC as a Service Market Size is valued at US$ 3.5 Bn in 2024 and is predicted to reach US$ 11.0 Bn by the year 2034 at an 12.6% CAGR during the forecast period for 2025-2034.

NOC as a service offers remote network administration and monitoring solutions. Because of its scalability, cost-effectiveness, and real-time problem-solving, it is essential to the smooth running of IT for companies across a variety of industries. The primary drivers of the NOC as a Service market expansion are the growing need for remote network monitoring and management solutions across a range of industries, as well as developments in cloud computing and artificial intelligence. Additionally, NOC as a service is being rapidly adopted globally due to the growing need for dependable, round-the-clock network oversight, the complexity of IT infrastructures, and the emergence of cloud-based services.
The NOC as a service market is also being driven by the rise in cyberthreats and the changing nature of network vulnerabilities. Businesses, particularly those in regulated sectors like government, healthcare, and BFSI, are under increasing pressure to adhere to strict privacy and data protection laws. A unified approach to controlling network performance and security risks is provided to enterprises by the growing prevalence of NOC and security operations center (SOC) activities combining.
Since proactive threat management is becoming more and more important to businesses, this trend is predicted to further accelerate market growth. However, there are a number of obstacles facing the NOC as a service market, chief among them being the lack of qualified personnel and the difficulty of overseeing multi-cloud and hybrid settings.
Some of the Key Players in NOC as a Service Market:
· Fujitsu
· Park Place Technologies
· iGlass Networks
· Infrassist Technologies
· CBS
· Quadrang Systems
· Futurism Technologies
· EXTNOC
· Mission Control NOC
· Worksent
· ConnectWise
· CHR Managed Services
· Kaseya
· Sify Technologies
· INOC
· Structured
· Science Soft
· Microscan Communications
· Tailwind Voice & Data
· Emapta
· GCX
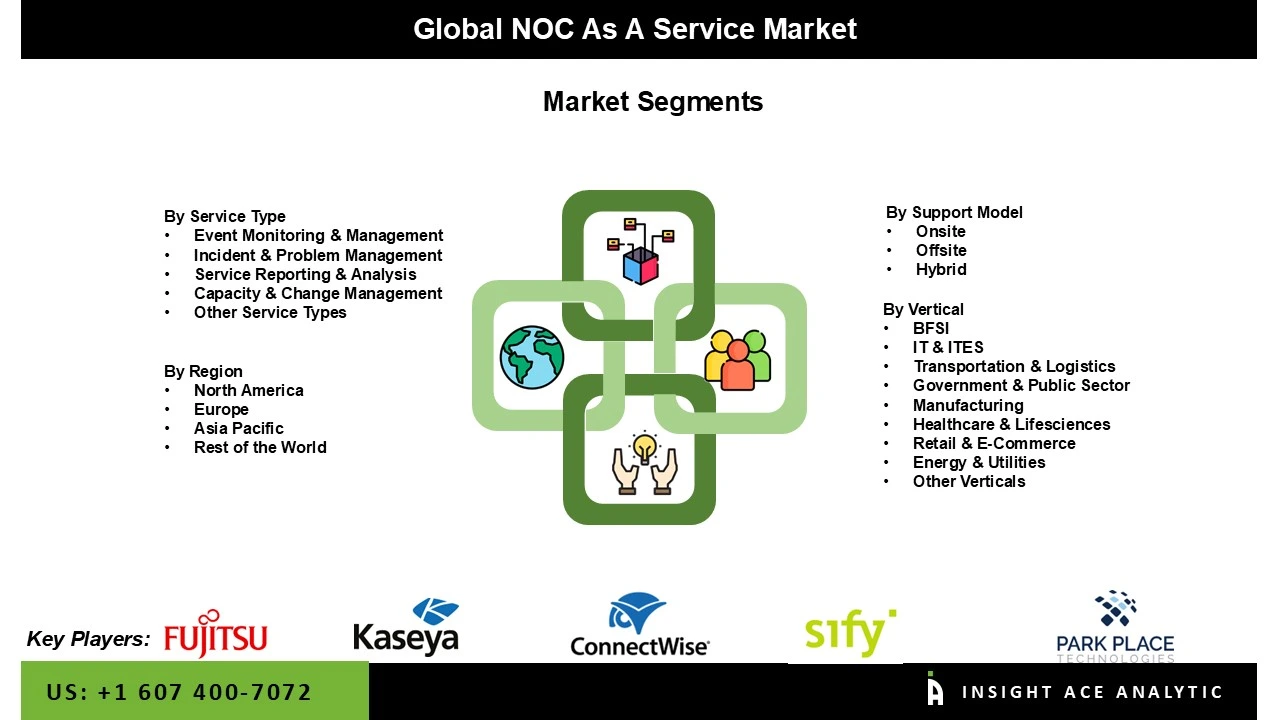
The NOC as a service market is segmented by service type, support model, and end-use. by service type, the market is segmented into service reporting & analysis, event monitoring & management, incident & problem management, capacity & change management, others. By support model, the market is segmented into offsite, onsite, and hybrid. By End-use, the market is segmented into IT & ITES, retail & e-commerce, banking, financial services, & insurance (BFSI), healthcare & life sciences, transportation & logistics, government & public sector, telecom & CSVS, energy & utilities, others.
The offsite category led the NOV as a service market in 2024. Offsite models are positioned to have the biggest market share because they focus operations around-the-clock where work is most consistent and repeatable, while maintaining governance through evidence and contracts rather than local staffing. Additionally, the offshore model achieves scalability by using multi-tenant technologies, standardizing runbooks and reporting, and publishing monthly evidence packs that satisfy the needs of numerous customers' service evaluations and internal audits at the same time.
In 2024, the Banking, Financial Services, & Insurance (BFSI) category held a sizable portion of the NOC as a Service market. The availability, dependability, and security of financial institutions' mission-critical networks are dependent on NOC as a services. Constant investment in cutting-edge NOC as a service solutions is being driven by the need to protect sensitive customer data, adhere to strict regulatory requirements, and avoid service interruptions. Because they allow for the comprehensive administration of network and security operations, integrated NOC and SOC capabilities are especially prized in the BFSI industry.
Regionally, North America Led the NOC as a Service Market
In 2024, North America held the biggest revenue share in the NOC as a Service Market, primarily because to the increased need for 24/7 network administration and monitoring as well as the expanding use of cloud-based services. NOC as a Service solutions are in high demand because businesses in the area place a high priority on proactive network performance management, quick issue response, and affordable IT infrastructure outsourcing.
Further contributing to this broad adoption are sophisticated IT infrastructure, a developed digital ecosystem, the existence of significant service providers, high IT budgets, and an emphasis on reducing network outages, which have made NOC as a Service the go-to option for companies in a variety of sectors, including BFSI, IT & telecommunications, and healthcare.
During the projection period, the Asia Pacific NOC as a Service market is expected to develop at the fastest rate. The regional growth is attributed to the proliferation of connected devices, growing expenditures in network infrastructure, and rapid digitization. The main markets are China, India, Japan, and South Korea, where businesses in the public sector, retail, and manufacturing sectors are pushing demand for cutting-edge NOC services. It is anticipated that government-led digital efforts and the region's sizable and varied SME base will further accelerate market growth in the years to come.
| Report Attribute | Specifications |
| Market Size Value In 2024 | USD 3.5 Bn |
| Revenue Forecast In 2034 | USD 11.0 Bn |
| Growth Rate CAGR | CAGR of 12.6% from 2025 to 2034 |
| Quantitative Units | Representation of revenue in US$ Bn and CAGR from 2025 to 2034 |
| Historic Year | 2021 to 2024 |
| Forecast Year | 2025-2034 |
| Report Coverage | The forecast of revenue, the position of the company, the competitive market structure, growth prospects, and trends |
| Segments Covered | By Service Type, By Support Model, By End-use |
| Regional Scope | North America; Europe; Asia Pacific; Latin America; Middle East & Africa |
| Country Scope | U.S.; Canada; Germany; The UK; France; Italy; Spain; Rest of Europe; China; Japan; India; South Korea; Southeast Asia; Rest of Asia Pacific; Brazil; Argentina; Mexico; Rest of Latin America; GCC Countries; South Africa; Rest of the Middle East and Africa |
| Competitive Landscape | Fujitsu, Park Place Technologies, iGlass Networks, Infrassist Technologies, CBS, Quadrang Systems, Futurism Technologies, EXTNOC, Mission Control NOC, Worksent, ConnectWise, CHR Managed Services, Kaseya, Sify Technologies, INOC,Structured, Science Soft, Microscan Communications, Tailwind Voice & Data, Emapta, and GCX. |
| Customization Scope | Free customization report with the procurement of the report, Modifications to the regional and segment scope. Geographic competitive landscape. |
| Pricing and Available Payment Methods | Explore pricing alternatives that are customized to your particular study requirements. |
NOC as a Service Market by Service Type-
· Service Reporting & Analysis
· Event Monitoring & Management
· Incident & Problem Management
· Capacity & Change Management
· Others

NOC as a Service Market by Support Model -
· Offsite
· Onsite
· Hybrid
NOC as a Service Market by End-use-
· IT & ITES
· Retail & E-commerce
· Banking, Financial Services, & Insurance (BFSI)
· Healthcare & Life Sciences
· Transportation & Logistics
· Government & Public Sector
· Telecom & CSVS
· Energy & Utilities
· Others
NOC as a Service Market by Region-
North America-
· The US
· Canada
Europe-
· Germany
· The UK
· France
· Italy
· Spain
· Rest of Europe
Asia-Pacific-
· China
· Japan
· India
· South Korea
· Southeast Asia
· Rest of Asia Pacific
Latin America-
· Brazil
· Argentina
· Mexico
· Rest of Latin America
Middle East & Africa-
· GCC Countries
· South Africa
· Rest of the Middle East and Africa
This study employed a multi-step, mixed-method research approach that integrates:
This approach ensures a balanced and validated understanding of both macro- and micro-level market factors influencing the market.
Secondary research for this study involved the collection, review, and analysis of publicly available and paid data sources to build the initial fact base, understand historical market behaviour, identify data gaps, and refine the hypotheses for primary research.
Secondary data for the market study was gathered from multiple credible sources, including:
These sources were used to compile historical data, market volumes/prices, industry trends, technological developments, and competitive insights.

Primary research was conducted to validate secondary data, understand real-time market dynamics, capture price points and adoption trends, and verify the assumptions used in the market modelling.
Primary interviews for this study involved:
Interviews were conducted via:
Primary insights were incorporated into demand modelling, pricing analysis, technology evaluation, and market share estimation.
All collected data were processed and normalized to ensure consistency and comparability across regions and time frames.
The data validation process included:
This ensured that the dataset used for modelling was clean, robust, and reliable.
The bottom-up approach involved aggregating segment-level data, such as:
This method was primarily used when detailed micro-level market data were available.

The top-down approach used macro-level indicators:
This approach was used for segments where granular data were limited or inconsistent.
To ensure accuracy, a triangulated hybrid model was used. This included:
This multi-angle validation yielded the final market size.
Market forecasts were developed using a combination of time-series modelling, adoption curve analysis, and driver-based forecasting tools.
Given inherent uncertainties, three scenarios were constructed:
Sensitivity testing was conducted on key variables, including pricing, demand elasticity, and regional adoption.