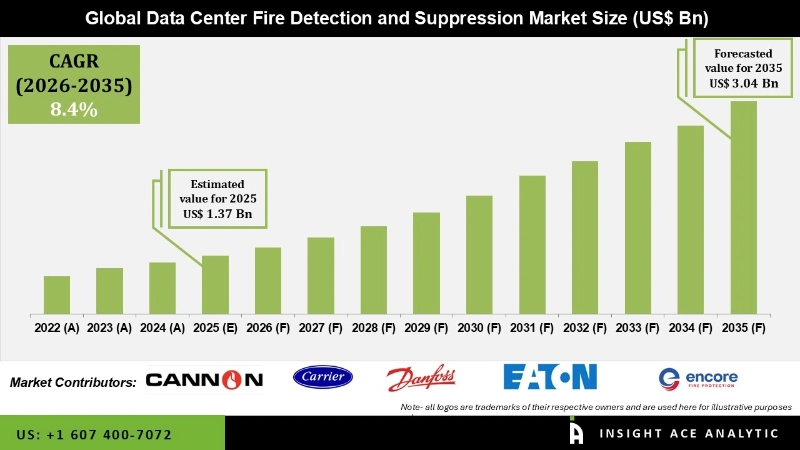
Global Data Center Fire Detection and Suppression Market Size is valued at USD 1.37 Bn in 2025 and is predicted to reach USD 3.04 Bn by the year 2035 at a 8.4% CAGR during the forecast period for 2026 to 2035.
Data Center Fire Detection and Suppression Market Size, Share & Trends Analysis Report, By Fire Safety Systems (Fire Detection and Fire Suppression), By Deployment Locations (Technical Space and Other Spaces), By Region, Forecasts, 2026 to 2035.

The data center fire detection and suppression market is rapidly increasing and is projected to remain so in the future years. With the increased reliance on data storage and cloud services, data centers require robust fire detection and suppression systems. These systems are intended to detect and extinguish fires early on, reducing potential damage and protecting the safety of key IT infrastructure.
The growing awareness of the potential hazards and financial losses connected with data center fires has resulted in increased investment in proactive fire protection strategies. Organizations are realizing the value of deploying modern fire detection and suppression technologies to safeguard their critical data and equipment. Moreover, Stringent laws and safety requirements enforced by governing bodies require data center operators to follow tight fire safety practices. Compliance with these rules involves the construction of dependable and effective fire detection and suppression systems. In addition, technological improvements drive the development of innovative fire detection and suppression technologies. These solutions include advanced features like early warning systems, intelligent smoke detection, and automatic fire suppression mechanisms, which improve the overall efficacy and efficiency of fire prevention measures in data centers.
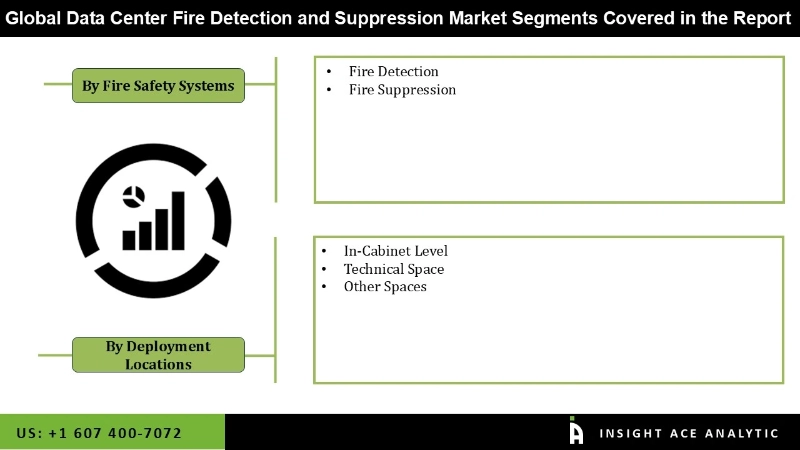
The data center fire detection and suppression market is segmented on the basis of fire safety systems and deployment locations. Based on fire safety systems, the market is segmented as fire detection and fire suppression. By deployment locations, the market is segmented into technical space and other spaces.
The fire suppression segment dominated the market and is expected to grow at the fastest rate among the fire safety systems segments during the forecast period. In data centers, fire suppression systems are crucial for fire safety. These systems use a variety of strategies, including water sprinklers, gas-based solutions, inert agents, and chemical extinguishers. The data center operator frequently favors a gas-based fire suppression system because of its proven success in protecting server rooms and IT equipment.
The technical space/room level segment dominated the data center fire detection and suppression market due to its relevance in day-to-day operations and the features of the machines in these rooms. Server rooms and data halls use a variety of fire suppression and detection techniques and equipment. Some common fire suppression and fire detection products are used globally in data centres in technical space (server room/data hall), such as inert gas fire suppression, which is suitable for server rooms and data rooms. The National Fire Protection Association (NFPA) has developed two standards, NFPA 75 and NFPA 76, exclusively for data center fire safety protection.
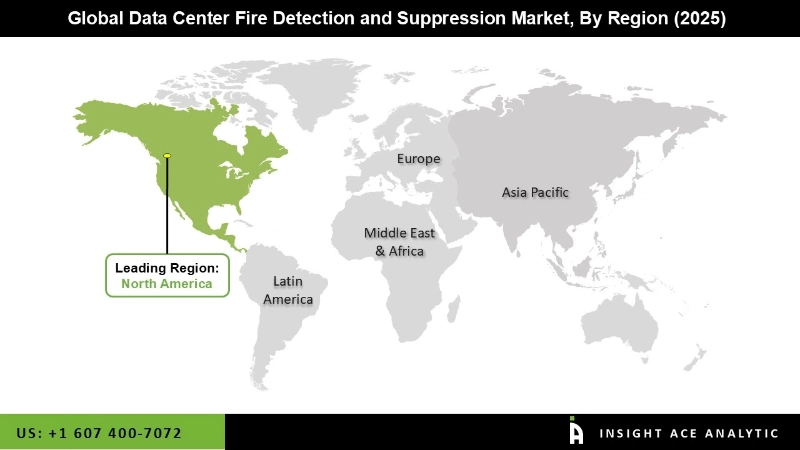
North America is the largest worldwide data center fire detection and suppression market shareholder. Fiber optic cables linked to satellites or telecommunications broadband access connect data centres to customers and businesses. The area is a primary driver and incumbent for any new technical advancement in the data center space. Furthermore, Asia-Pacific is expected to grow at a CAGR throughout the projection period. The growing number of internet users, increased smartphone penetration, acceptance of public cloud and hybrid cloud services, increased usage of social media, and the need for enterprises to shift from server room settings to data centers are all important drivers in the Asia-Pacific data center market.

| Report Attribute | Specifications |
| Market Size Value In 2025 | USD 1.37 Bn |
| Revenue Forecast In 2035 | USD 3.04 Bn |
| Growth Rate CAGR | CAGR of 8.4 % from 2026 to 2035 |
| Quantitative Units | Representation of revenue in US$ Bn and CAGR from 2026 to 2035 |
| Historic Year | 2022 to 2024 |
| Forecast Year | 2026-2035 |
| Report Coverage | The forecast of revenue, the position of the company, the competitive market structure, growth prospects, and trends |
| Segments Covered | By Fire Safety Systems, By Deployment Locations |
| Regional Scope | North America; Europe; Asia Pacific; Latin America; Middle East & Africa |
| Country Scope | U.S.; Canada; U.K.; Germany; China; India; Japan; Brazil; Mexico; France; Italy; Spain; South East Asia; South Korea |
| Competitive Landscape | Automatic, AVA PREVENT, Cannon Fire Protection, Carrier, Danfoss Fire Safety, Eaton, Encore Fire Protection, Fike, Fireboy-Xintex (A Darley Company), Halma, Hochiki Europe, Honeywell HBT, InControl Systems, Johnson Controls, Minimax (Viking Group), Pro Delta Fire Safety Systems, Robert Bosch, Securiton SEVO Systems, Siemens, Smith & Sharks, STANG Korea, Sterling Safety Systems (Hyfire), The Chemours Company, The Hiller Companies, Torvac Solutions, WAGNER Group, Others |
| Customization Scope | Free customization report with the procurement of the report and modifications to the regional and segment scope. Particular Geographic competitive landscape. |
| Pricing And Available Payment Methods | Explore pricing alternatives that are customized to your particular study requirements. |
By Fire Safety Systems -

By Deployment Locations -
By Region-
North America-
Europe-
Asia-Pacific-
Latin America-
Middle East & Africa-
Chapter 1. Methodology and Scope
1.1. Research Methodology
1.2. Research Scope & Assumptions
Chapter 2. Executive Summary
Chapter 3. Global Data Center Fire Detection and Suppression Market Snapshot
Chapter 4. Global Data Center Fire Detection and Suppression Market Variables, Trends & Scope
4.1. Market Segmentation & Scope
4.2. Drivers
4.3. Challenges
4.4. Trends
4.5. Investment and Funding Analysis
4.6. Industry Analysis – Porter’s Five Forces Analysis
4.7. Competitive Landscape & Market Share Analysis
4.8. Impact of Covid-19 Analysis
Chapter 5. Market Segmentation 1: by Fire Safety Estimates & Trend Analysis
5.1. by Fire Safety & Market Share, 2025 & 2035
5.2. Market Size (Value (US$ Mn)) & Forecasts and Trend Analyses, 2022 to 2035 for the following by Fire Safety:
5.2.1. Fire Detection
5.2.2. Fire Suppression
Chapter 6. Market Segmentation 2: by Deployment Locations: Estimates & Trend Analysis
6.1. by Deployment Locations: & Market Share, 2025 & 2035
6.2. Market Size (Value (US$ Mn)) & Forecasts and Trend Analyses, 2022 to 2035 for the following by Deployment Locations;
6.2.1. Technical Space
6.2.2. Other Space
Chapter 7. Data Center Fire Detection and Suppression Market Segmentation 3: Regional Estimates & Trend Analysis
7.1. North America
7.1.1. North America Data Center Fire Detection and Suppression Market Revenue (US$ Million) Estimates and Forecasts by Fire Safety, 2022 - 2035
7.1.2. North America Data Center Fire Detection and Suppression Market Revenue (US$ Million) Estimates and Forecasts by Deployment Locations, 2022 - 2035
7.1.3. North America Data Center Fire Detection and Suppression Market Revenue (US$ Million) Estimates and Forecasts by country, 2022 - 2035
7.2. Europe
7.2.1. Europe Data Center Fire Detection and Suppression Market Revenue (US$ Million) Estimates and Forecasts by Fire Safety, 2022 - 2035
7.2.2. Europe Data Center Fire Detection and Suppression Market Revenue (US$ Million) Estimates and Forecasts by Deployment Locations: 2022 - 2035
7.2.3. Europe Data Center Fire Detection and Suppression Market Revenue (US$ Million) Estimates and Forecasts by country, 2022 - 2035
7.3. Asia Pacific
7.3.1. Asia Pacific Data Center Fire Detection and Suppression Market Revenue (US$ Million) Estimates and Forecasts by Fire Safety, 2022 - 2035
7.3.2. Asia Pacific Data Center Fire Detection and Suppression Market Revenue (US$ Million) Estimates and Forecasts by Deployment Locations, 2022 - 2035
7.3.3. Asia Pacific Data Center Fire Detection and Suppression Market Revenue (US$ Million) Estimates and Forecasts by country, 2022 - 2035
7.4. Latin America
7.4.1. Latin America Data Center Fire Detection and Suppression Market Revenue (US$ Million) Estimates and Forecasts by Fire Safety, 2022 - 2035
7.4.2. Latin America Data Center Fire Detection and Suppression Market Revenue (US$ Million) Estimates and Forecasts by Deployment Locations, 2022 - 2035
7.4.3. Latin America Data Center Fire Detection and Suppression Market Revenue (US$ Million) Estimates and Forecasts by country, 2022 - 2035
7.5. Middle East & Africa
7.5.1. Middle East & Africa Data Center Fire Detection and Suppression Market Revenue (US$ Million) Estimates and Forecasts by Fire Safety, 2022 - 2035
7.5.2. Middle East & Africa Data Center Fire Detection and Suppression Market Revenue (US$ Million) Estimates and Forecasts by Deployment Locations, 2022 - 2035
7.5.3. Middle East & Africa Data Center Fire Detection and Suppression Market Revenue (US$ Million) Estimates and Forecasts by country, 2022 - 2035
Chapter 8. Competitive Landscape
8.1. Major Mergers and Acquisitions/Strategic Alliances
8.2. Company Profiles
8.2.1. AVA PREVENT
8.2.2. Cannon Fire Protection
8.2.3. Carrier
8.2.4. Danfoss Fire Safety
8.2.5. Eaton
8.2.6. Encore Fire Protection
8.2.7. Fike
8.2.8. Fireboy-Xintex (A Darley Company)
8.2.9. Halma
8.2.10. Hochiki Europe
8.2.11. Honeywell HBT
8.2.12. InControl Systems
8.2.13. Johnson Controls
8.2.14. Minimax (Viking Group)
8.2.15. Pro Delta Fire Safety Systems
8.2.16. Robert Bosch
8.2.17. Securiton
8.2.18. SEVO Systems
8.2.19. Siemens
8.2.20. Smith & Sharks (India)
8.2.21. STANG Korea
8.2.22. Sterling Safety Systems (Hyfire)
8.2.23. The Chemours Company
8.2.24. The Hiller Companies
8.2.25. Torvac Solutions
8.2.26. WAGNER Group
8.2.27. Other Prominent Players