logo image
search icon
Augmented & Virtual Reality Market

Augmented & Virtual Reality Market Size, Share & Trends Analysis Report by Enterprise (Small, Medium, Large), Technology ( AR and VR), Offering (Hardware, Software), Device Type (AR, VR Devices), Application (AR Application, VR Application), By Region, And By Segment Forecasts, 2024-2031

Report ID : 2164 | Published : 2024-03-12 | Pages: 180 | Format: PDF/EXCEL

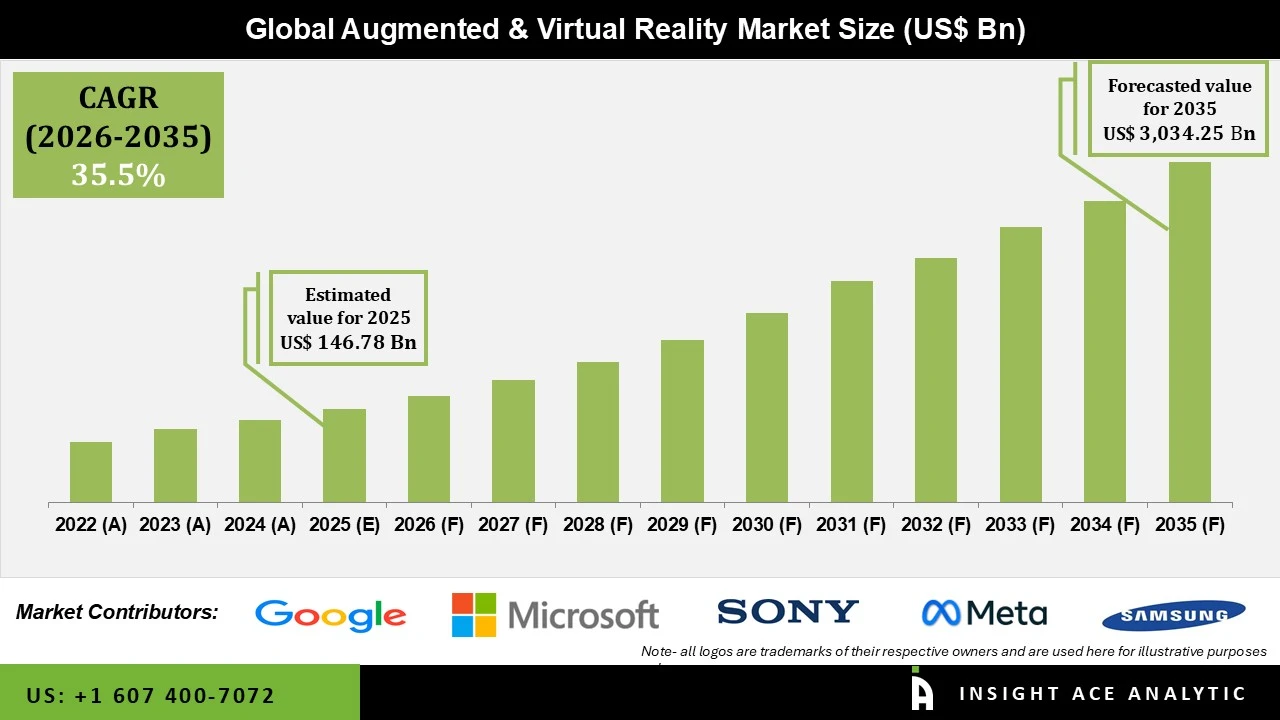
Augmented & Virtual Reality Market Size is valued at USD 50.47 Bn in 2023 and is predicted to reach USD 677.73 Bn by the year 2031 at a 38.49% CAGR during the forecast period for 2024-2031. 

Augmented & Virtual Reality

AR and VR technologies have transformative potential in healthcare, education, entertainment, and business industries, offering new ways to engage users and provide innovative solutions. Small and medium-sized enterprises (MSMEs) in today's market increasingly rely on this technology to differentiate themselves, stand out from the crowd, and win and keep customers. Industries are aggressively investigating uses for augmented reality (AR) technology in training, maintenance, support, and monitoring. Growth in the industry is expected to be spurred by the proliferation of smartphones and the popularity of apps. Furthermore, virtual reality (VR) technology allows for a completely new and unique experience by completely isolating users from their surroundings. In most cases, this is accomplished using a virtual reality (VR) headset equipped with a high-definition screen, a motion-tracking sensor, and sometimes even separate hand controllers.

However, the market growth is hampered by the strict regulatory criteria for safety and the lack of norms and protocols in the augmented & virtual reality market. The network's foundation becomes critical in determining the feasibility and quality of user experiences. Since increasingly more augmented reality apps are moving to the cloud, having a reliable and low-latency connection is more important than ever. This infrastructure is the backbone for continuous two-way communication between the digital and physical spheres. The outbreak and spread of COVID-19 have upset and damaged the stocks of companies manufacturing and supplying components for augmented and virtual reality devices because of the lockdowns imposed in several countries due to the COVID-19 outbreak, suppliers of components for augmented and virtual reality devices saw their stock levels plummet. 

Competitive Landscape

Some Major Key Players In The Augmented & Virtual Reality Market:

  • Google (U.S.)
  • Microsoft (U.S.)
  • Sony Group Corporation (Japan)
  • META (U.S.)
  • SAMSUNG (South Korea)
  • HTC Corporation (Taiwan)
  • Apple Inc. (U.S.)
  • PTC Inc. (U.S.)
  • Seiko Epson Corporation (Japan)
  • Lenovo (China)
  • Wikitude, a Qualcomm company (Austria)
  • EON Reality (U.S.)
  • MAXST Co.Ltd. (South Korea)
  • Magic Leap Inc. (U.S.)
  • Blippar Group Limited(UK)
  • Atheer Inc (U.S.)
  • Vuzix (U.S.)
  • CyberGlove Systems Inc. (U.S.)
  • Leap Motions (Ultraleap) (U.S.)
  • Penumbra Inc. (U.S.)
  • Nintendo (Japan)
  • PSICO SMART APPS S.L. (Spain)
  • Xiaomi (China)
  • Panasonic Corporation (Japan)
  • Scope AR (U.S.)
  • Continental AG (Germany)
  • Virtually Live (Switzerland)
  • SpaceVR Inc (U.S.)
  • Intel Corporation (U.S.)
  • 3D Cloud by Marxent (U.S.)
  • WayRay AG (Switzerland)
  • Crafters (Romania)
  • Talespin Reality Labs Inc. (U.S.)
  • BidOn Games Studio (Ukraine)
  • Appentus technologies (India)
  • ByteDance (China)
  • DPVR (China)
  • Others

Market Segmentation:

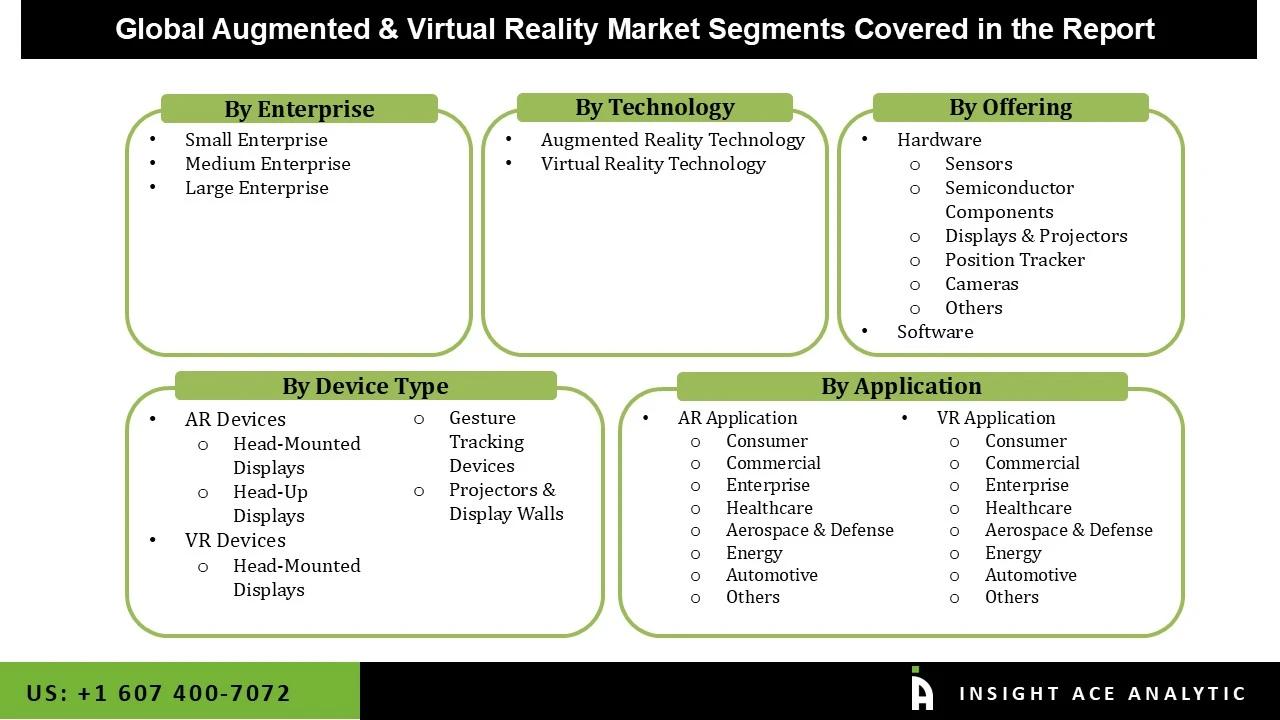
The augmented & virtual reality market is segmented based on enterprise, technology, offering, device, and application. As per the segment enterprise, the market is segmented into small, medium, and large. By technology, the market is segmented into AR and VR. According to the offering, the market is segmented into hardware and software. The hardware segment includes Sensors, Semiconductor Components, Displays and projectors, Position Tracker, Cameras, and Others. By device type, the market is segmented into AR devices, which include Head-Mounted Displays and head-up Displays, Whereas VR devices consist of Head-Mounted Displays, Gesture Tracking Devices, and Projectors and display Walls. The application segment comprises AR Applications and VR Applications. AR Applications include Consumer, Commercial, Enterprise, Healthcare, Aerospace and defence, Energy, Automotive, and Others. VR Application also consists of Consumer, Commercial, Enterprise, Healthcare, Aerospace and defence, Energy, Automotive, and Others.

Based On The Offering, The Hardware Augmented & Virtual Reality Market Segment Is Accounted As A Major Contributor To The Augmented & Virtual Reality Market.

The hardware augmented & virtual reality market is expected to hold a major global market share in 2024. Hardware is purpose-built to execute a task at lightning speed, and it can often accomplish this more swiftly than software alone. Hardware is more error- and corruption-resistant than software.

VR Application Segment To Witness Growth At A Rapid Rate.

The VR application segment is projected to grow rapidly in the global augmented & virtual reality market. Virtual reality can aid in the understanding of fundamental ideas for both students and professionals. Learners can control their learning rate thanks to technological advancements. Understanding and remembering knowledge is greatly enhanced when students are able to picture it, especially in countries like the US, Germany, the UK, China, and India.

In The Region, The Asia Pacific Augmented & Virtual Reality Market Holds A Significant Revenue Share.

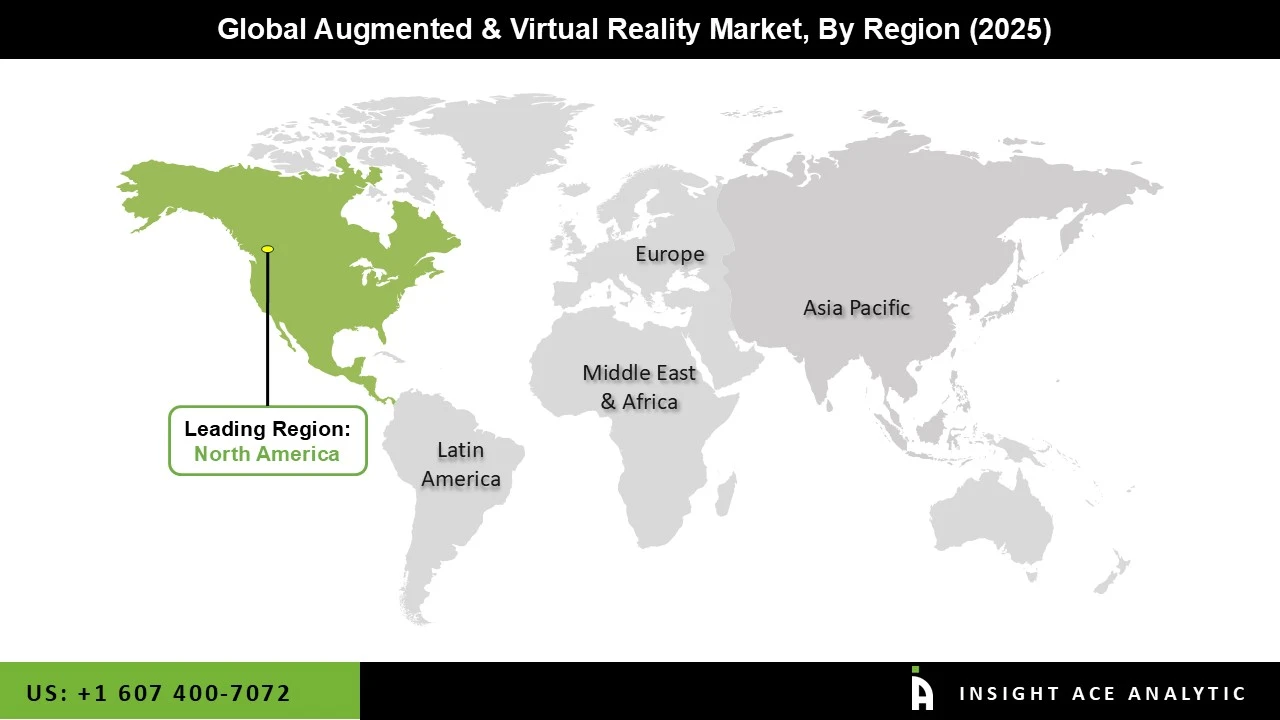
The Asia Pacific augmented & virtual reality market is expected to record the maximum market share in revenue in the near future. It can be attributed to corporations embracing innovation with open arms. It is the most lucrative market, generating a considerable share of AR's total sales. The proliferation of augmented reality devices among corporate users to boost productivity and accuracy has been a major element in the industry's growth. In addition, North America is projected to grow rapidly in the global augmented & virtual reality market because of rising demand for digital solutions in sectors including healthcare, retail, and transportation. 
Recent Developments:

  • In Sept 2023, Apple faces competition from Meta's New Quest 3 Headset. This year, Meta unveiled a four-year roadmap for its virtual reality and augmented reality hardware. In 2025, a pair of smart spectacles and a smartwatch will follow the new Quest headset, further pitting Apple and Meta against one another for virtual world hardware supremacy.
  • In July 2023, PTC and Rockwell Automation extended their relationship in an effort to encourage more manufacturers to adopt IoT and A.R. solutions. Existing and new customers in the discrete and process manufacturing industries should expect Rockwell Automation to continue offering PTC's Thing Worx Internet of Things software and Vuforia augmented reality software. 

Augmented & Virtual Reality Market Report Scope

Report Attribute

Specifications

Market Size Value In 2023

USD 50.47 Bn

Revenue Forecast In 2031

USD 677.73 Bn

Growth Rate CAGR

CAGR of 38.49 % from 2024 to 2031

Quantitative Units

Representation of revenue in US$ Bn and CAGR from 2024 to 2031

Historic Year

2019 to 2023

Forecast Year

2024-2031

Report Coverage

The forecast of revenue, the position of the company, the competitive market structure, growth prospects, and trends

Segments Covered

By Enterprise, Technology, Offering, Device Type, and Application

Regional Scope

North America; Europe; Asia Pacific; Latin America; Middle East & Africa

Country Scope

U.S.; Canada; U.K.; Germany; China; India; Japan; Brazil; Mexico ;The UK; France; Italy; Spain; China; Japan; India; South Korea; South East Asia; South Korea; South East Asia

Competitive Landscape

Google (US), Microsoft (US), Sony Group Corporation (Japan), META (US), SAMSUNG (South Korea), HTC Corporation (Taiwan), Apple Inc. (US), PTC Inc. (US), Seiko Epson Corporation (Japan), Lenovo (China), Wikitude, a Qualcomm company (Austria), EON Reality (US), MAXST Co., Ltd. (South Korea), Magic Leap, Inc. (US),  Blippar Group Limited(UK),  Atheer, Inc (US), Vuzix (US), CyberGlove Systems Inc. (US), Leap Motions (Ultraleap) (US), Penumbra, Inc. (US), Nintendo (Japan), PSICO SMART APPS, S.L. (Spain), Xiaomi (China), Panasonic Corporation (Japan), Scope AR (US), Continental AG (Germany), Virtually Live (Switzerland),  SpaceVR Inc (US), Intel Corporation (US), 3D Cloud by Marxent (US), WayRay AG (Switzerland), Craftars (Romania),  Talespin Reality Labs, Inc. (US), BidOn Games Studio (Ukraine), appentus technologies (India), ByteDance (China), and DPVR (China)

Customization Scope

Free customization report with the procurement of the report and modifications to the regional and segment scope. Particular Geographic competitive landscape.

Pricing And Available Payment Methods

Explore pricing alternatives that are customized to your particular study requirements.

Chapter 1. Methodology and Scope

1.1. Research Methodology

1.2. Research Scope & Assumptions

Chapter 2. Executive Summary

Chapter 3. Global Augmented & Virtual Reality Market Snapshot

Chapter 4. Global Augmented & Virtual Reality Market Variables, Trends & Scope

4.1. Market Segmentation & Scope

4.2. Drivers

4.3. Challenges

4.4. Trends

4.5. Investment and Funding Analysis

4.6. Industry Analysis – Porter’s Five Forces Analysis

4.7. Competitive Landscape & Market Share Analysis

4.8. Impact of Covid-19 Analysis

Chapter 5. Market Segmentation 1: By Enterprise Estimates & Trend Analysis

5.1. By Enterprise, & Market Share, 2019 & 2031

5.2. Market Size (Value US$ Mn) & Forecasts and Trend Analyses, 2019 to 2031 for the following By Enterprise:

5.2.1. Small Enterprises

5.2.2. Medium Enterprises

5.2.3. Large Enterprises

Chapter 6. Market Segmentation 2: By Technology Estimates & Trend Analysis

6.1. By Technology & Market Share, 2019 & 2031

6.2. Market Size (Value US$ Mn) & Forecasts and Trend Analyses, 2019 to 2031 for the following By Technology:

6.2.1. Augmented Reality Technology

6.2.2. Virtual Reality Technology

Chapter 7. Market Segmentation 3: By Offering Estimates & Trend Analysis

7.1. By Offering & Market Share, 2019 & 2031

7.2. Market Size (Value US$ Mn) & Forecasts and Trend Analyses, 2019 to 2031 for the following By Offering:

7.2.1. Hardware

7.2.1.1. Sensors

7.2.1.2. Semiconductor Components

7.2.1.3. Displays & Projectors

7.2.1.4. Position Tracker

7.2.1.5. Cameras

7.2.1.6. Others

7.2.2. Software

Chapter 8. Market Segmentation 4: By Device Type Estimates & Trend Analysis

8.1. By Device Type & Market Share, 2019 & 2031

8.2. Market Size (Value US$ Mn) & Forecasts and Trend Analyses, 2019 to 2031 for the following By Device Type:

8.2.1. Augmented Reality Devices

8.2.1.1. Head-Mounted Displays

8.2.1.2. Head-Up Displays

8.2.2. Virtual Reality Devices

8.2.2.1. Head-Mounted Displays

8.2.2.2. Gesture Tracking Devices

8.2.2.3. Projectors & Display Walls

Chapter 9. Market Segmentation 5: By Application Estimates & Trend Analysis

9.1. By Application & Market Share, 2019 & 2031

9.2. Market Size (Value US$ Mn) & Forecasts and Trend Analyses, 2019 to 2031 for the following By Application:

9.2.1. Augmented Reality Application

9.2.1.1. Consumer

9.2.1.2. Commercial

9.2.1.3. Enterprise

9.2.1.4. Healthcare

9.2.1.5. Aerospace & Defense

9.2.1.6. Energy

9.2.1.7. Automotive

9.2.1.8. Others

9.2.2. Virtual Reality Application

9.2.2.1. Consumer

9.2.2.2. Commercial

9.2.2.3. Enterprise

9.2.2.4. Healthcare

9.2.2.5. Aerospace & Defense

9.2.2.6. Others

9.2.3. Indoor Farms

9.2.4. Others 

Chapter 10. Augmented & Virtual Reality Market Segmentation 6: Regional Estimates & Trend Analysis

10.1. North America

10.1.1. North America Augmented & Virtual Reality Market revenue (US$ Million) estimates and forecasts By Enterprise, 2024-2031

10.1.2. North America Augmented & Virtual Reality Market revenue (US$ Million) estimates and forecasts By Technology, 2024-2031

10.1.3. North America Augmented & Virtual Reality Market revenue (US$ Million) estimates and forecasts By Offering, 2024-2031

10.1.4. North America Augmented & Virtual Reality Market revenue (US$ Million) estimates and forecasts By Device Type, 2024-2031

10.1.5. North America Augmented & Virtual Reality Market revenue (US$ Million) estimates and forecasts By Application, 2024-2031

10.1.6. North America Augmented & Virtual Reality Market revenue (US$ Million) estimates and forecasts by country, 2024-2031

10.2. Europe

10.2.1. Europe Augmented & Virtual Reality Market revenue (US$ Million) By Enterprise, 2024-2031

10.2.2. Europe Augmented & Virtual Reality Market revenue (US$ Million) By Technology, 2024-2031

10.2.3. Europe Augmented & Virtual Reality Market revenue (US$ Million) By Offering, 2024-2031

10.2.4. Europe Augmented & Virtual Reality Market revenue (US$ Million) By Device Type, 2024-2031

10.2.5. Europe Augmented & Virtual Reality Market revenue (US$ Million) By Application, 2024-2031

10.2.6. Europe Augmented & Virtual Reality Market revenue (US$ Million) by country, 2024-2031

10.3. Asia Pacific

10.3.1. Asia Pacific Augmented & Virtual Reality Market revenue (US$ Million) By Enterprise, 2024-2031

10.3.2. Asia Pacific Augmented & Virtual Reality Market revenue (US$ Million) By Technology, 2024-2031

10.3.3. Asia Pacific Augmented & Virtual Reality Market revenue (US$ Million) By Offering, 2024-2031

10.3.4. Asia Pacific Augmented & Virtual Reality Market revenue (US$ Million) By Device Type, 2024-2031

10.3.5. Asia Pacific Augmented & Virtual Reality Market revenue (US$ Million) By Application, 2024-2031

10.3.6. Asia Pacific Augmented & Virtual Reality Market revenue (US$ Million) by country, 2024-2031

10.4. Latin America

10.4.1. Latin America Augmented & Virtual Reality Market revenue (US$ Million) By Enterprise, (US$ Million) 2024-2031

10.4.2. Latin America Augmented & Virtual Reality Market revenue (US$ Million) By Technology, (US$ Million) 2024-2031

10.4.3. Latin America Augmented & Virtual Reality Market revenue (US$ Million) By Offering, (US$ Million) 2024-2031

10.4.4. Latin America Augmented & Virtual Reality Market revenue (US$ Million) By Device Type, (US$ Million) 2024-2031

10.4.5. Latin America Augmented & Virtual Reality Market revenue (US$ Million) By Application, (US$ Million) 2024-2031

10.4.6. Latin America Augmented & Virtual Reality Market revenue (US$ Million) by country, 2024-2031

10.5. Middle East & Africa

10.5.1. Middle East & Africa Augmented & Virtual Reality Market revenue (US$ Million) By Enterprise, (US$ Million) 2024-2031

10.5.2. Middle East & Africa Augmented & Virtual Reality Market revenue (US$ Million) By Technology, (US$ Million) 2024-2031

10.5.3. Middle East & Africa Augmented & Virtual Reality Market revenue (US$ Million) By Offering, (US$ Million) 2024-2031

10.5.4. Middle East & Africa Augmented & Virtual Reality Market revenue (US$ Million) By Device Type, (US$ Million) 2024-2031

10.5.5. Middle East & Africa Augmented & Virtual Reality Market revenue (US$ Million) By Application, (US$ Million) 2024-2031

10.5.6. Middle East & Africa Augmented & Virtual Reality Market revenue (US$ Million) by country, 2024-2031

Chapter 11. Competitive Landscape

11.1. Major Mergers and Acquisitions/Strategic Alliances

11.2. Company Profiles

11.2.1. Google (US)

11.2.2. Microsoft (US)

11.2.3. Sony Group Corporation (Japan)

11.2.4. META (US)

11.2.5. SAMSUNG (South Korea)

11.2.6. HTC Corporation (Taiwan)

11.2.7. Apple Inc. (US)

11.2.8. PTC Inc. (US)

11.2.9. Seiko Epson Corporation (Japan)

11.2.10. Lenovo (China)

11.2.11. Wikitude, a Qualcomm company (Austria)

11.2.12. EON Reality (US)

11.2.13. MAXST Co., Ltd. (South Korea)

11.2.14. Magic Leap, Inc. (US)

11.2.15. Blippar Group Limited(UK)

11.2.16. Atheer, Inc (US)

11.2.17. Vuzix (US)

11.2.18. CyberGlove Systems Inc. (US)

11.2.19. Leap Motions (Ultraleap) (US)

11.2.20. Penumbra, Inc. (US)

11.2.21. Nintendo (Japan)

11.2.22. PSICO SMART APPS, S.L. (Spain)

11.2.23. Xiaomi (China)

11.2.24. Panasonic Corporation (Japan)

11.2.25. Scope AR (US)

11.2.26. Continental AG (Germany)

11.2.27. Virtually Live (Switzerland)

11.2.28. SpaceVR Inc (US)

11.2.29. Intel Corporation (US)

11.2.30. 3D Cloud by Marxent (US)

11.2.31. WayRay AG (Switzerland)

11.2.32. Craftars (Romania)

11.2.33. Talespin Reality Labs, Inc. (US)

11.2.34. BidOn Games Studio (Ukraine)

11.2.35. appentus technologies (India)

11.2.36. ByteDance (China)

11.2.37. DPVR (China)

Segmentation Of Augmented & Virtual Reality Market-

Augmented & Virtual Reality Market By Enterprise-
  • Small Enterprise
  • Medium Enterprise
  • Large Enterprise 

Augmented & Virtual Reality

Augmented & Virtual Reality Market By Technology-

  • Augmented Reality Technology
  • Virtual Reality Technology

Augmented & Virtual Reality Market By Offering-

  • Hardware
    • Sensors
    • Semiconductor Components
    • Displays & Projectors
    • Position Tracker
    • Cameras
    • Others
  • Software

Augmented & Virtual Reality Market By Device Type

  • AR Devices
    • Head-Mounted Displays
    • Head-Up Displays
  • VR Devices
    • Head-Mounted Displays
    • Gesture Tracking Devices
    • Projectors & Display Walls

Augmented & Virtual Reality Market By Application-

  • AR Application
    • Consumer
    • Commercial
    • Enterprise
    • Healthcare
    • Aerospace & Defense
    • Energy
    • Automotive
    • Others
  • VR Application
    • Consumer
    • Commercial
    • Enterprise
    • Healthcare
    • Aerospace & Defense
    • Energy
    • Automotive
    • Others


Augmented & Virtual Reality Market By Region-

North America-

  • The US
  • Canada
  • Mexico

Europe-

  • Germany
  • The UK
  • France
  • Italy
  • Spain
  • Rest of Europe

Asia-Pacific-

  • China
  • Japan
  • India
  • South Korea
  • Southeast Asia
  • Rest of Asia Pacific

Latin America-

  • Brazil
  • Argentina
  • Rest of Latin America

 Middle East & Africa-

  • GCC Countries
  • South Africa
  • Rest of the Middle East and Africa

InsightAce Analytic follows a standard and comprehensive market research methodology focused on offering the most accurate and precise market insights. The methods followed for all our market research studies include three significant steps – primary research, secondary research, and data modeling and analysis - to derive the current market size and forecast it over the forecast period. In this study, these three steps were used iteratively to generate valid data points (minimum deviation), which were cross-validated through multiple approaches mentioned below in the data modeling section.

Through secondary research methods, information on the market under study, its peer, and the parent market was collected. This information was then entered into data models. The resulted data points and insights were then validated by primary participants.

Based on additional insights from these primary participants, more directional efforts were put into doing secondary research and optimize data models. This process was repeated till all data models used in the study produced similar results (with minimum deviation). This way, this iterative process was able to generate the most accurate market numbers and qualitative insights.

Secondary research

The secondary research sources that are typically mentioned to include, but are not limited to:

  • Company websites, financial reports, annual reports, investor presentations, broker reports, and SEC filings.
  • External and internal proprietary databases, regulatory databases, and relevant patent analysis
  • Statistical databases, National government documents, and market reports
  • Press releases, news articles, and webcasts specific to the companies operating in the market

The paid sources for secondary research like Factiva, OneSource, Hoovers, and Statista

Primary Research:

Primary research involves telephonic interviews, e-mail interactions, as well as face-to-face interviews for each market, category, segment, and subsegment across geographies

The contributors who typically take part in such a course include, but are not limited to: 

  • Industry participants: CEOs, CBO, CMO, VPs, marketing/ type managers, corporate strategy managers, and national sales managers, technical personnel, purchasing managers, resellers, and distributors.
  • Outside experts: Valuation experts, Investment bankers, research analysts specializing in specific markets
  • Key opinion leaders (KOLs) specializing in unique areas corresponding to various industry verticals
  • End-users: Vary mainly depending upon the market

Data Modeling and Analysis:

In the iterative process (mentioned above), data models received inputs from primary as well as secondary sources. But analysts working on these models were the key. They used their extensive knowledge and experience about industry and topic to make changes and fine-tuning these models as per the product/service under study.

The standard data models used while studying this market were the top-down and bottom-up approaches and the company shares analysis model. However, other methods were also used along with these – which were specific to the industry and product/service under study.

To know more about the research methodology used for this study, kindly contact us/click here.

user icon
office icon
mail icon
call icon

This website is secure, and we do not share your personal information with any third party. Privacy Policy

Need Customization
Need specific information/chapter from the report of the custom data table, graph or complete report? Tell us more.

Frequently Asked Questions

How big is the Augmented & Virtual Reality Market Size?

Augmented & Virtual Reality Market is expected to grow at a 38.49% CAGR during the forecast period for 2024-2031.

Intel Corporation (US), 3D Cloud by Marxent (US), WayRay AG (Switzerland), Craftars (Romania), Talespin Reality Labs, Inc. (US), BidOn Games Studio (

Our Clients

  • client logo
  • client logo
  • client logo
  • client logo
  • client logo
  • client logo
  • client logo
  • client logo
  • client logo
  • client logo
  • client logo
  • client logo
  • client logo
  • client logo
  • client logo
  • client logo
  • client logo
  • client logo
  • client logo
  • client logo
  • client logo
  • client logo
  • client logo
  • client logo
  • client logo
  • client logo
  • client logo
  • client logo
  • client logo
  • client logo
  • client logo
  • client logo
  • client logo
  • client logo
  • client logo
  • client logo
  • client logo
  • client logo
  • client logo
  • client logo

Media Citations

  • media citation logo
  • media citation logo
  • media citation logo
  • media citation logo
  • media citation logo
  • media citation logo
  • media citation logo
  • media citation logo
  • media citation logo

Growth opportunities and latent adjacency in Technology

Select Licence Type
$4456
$7786
$10000
$1200
Get Your GTM Strategy

Navigate market entry with channel selection, launch strategy & timeline, and pricing model support.

Equip yourself with the insights needed to develop a winning go-to-market strategy

Get real-time updates and joint control over project direction with our collaborative approach