AI In Life Science Analytics Market Size, Share, Trend, Revenue Report 2026 to 2035
Segmentation of AI In Life Science Analytics Market :
AI In Life Science Analytics Market, By Application / Value-Chain Layer-
- Discovery, Target ID & Translational Research Analytics
- Target & Biomarker Identification, Ranking & Tractability
- Generative Molecular Design & Predictive Screening
- Scientific & Evidence Intelligence
- Translational, Multi-Omics & Precision-Medicine Analytics
- Clinical Development & Trial Analytics
- Trial Design, Feasibility & Site / Investigator Selection
- Patient Recruitment, Enrolment Forecasting & Diversity
- Clinical Data Management, Review & Centralised / Risk-Based Monitoring
- Digital Twins, Synthetic & External Control Arms
- Real-World Evidence, Epidemiology & Patient Analytics
- RWD Curation, Tokenisation & Linkage
- Epidemiology, Patient-Journey & HEOR Analytics
- Regulatory-Grade RWE, Comparative Effectiveness & Post-Market Safety
- Pharmacovigilance, Safety & Regulatory Analytics
- Case Intake, Processing & Automated Assessment
- Signal Detection & Literature Surveillance
- Regulatory Information Management & Submission Intelligence
- Medical Affairs, Commercial & Customer Analytics
- Commercial Analytics, Forecasting & Market Access
- Field-Force, Territory & Incentive-Compensation Analytics
- Omnichannel Next-Best-Action & Customer Engagement
- Medical Affairs & Competitive Intelligence
- Scientific-Data, Laboratory Informatics & AI-Foundation Layer
- Scientific-Data Management & Instrument / Lab-Data Engineering
- Ontologies, Semantic Enrichment & Knowledge Graphs
- Omics & Bioinformatics Data Platforms
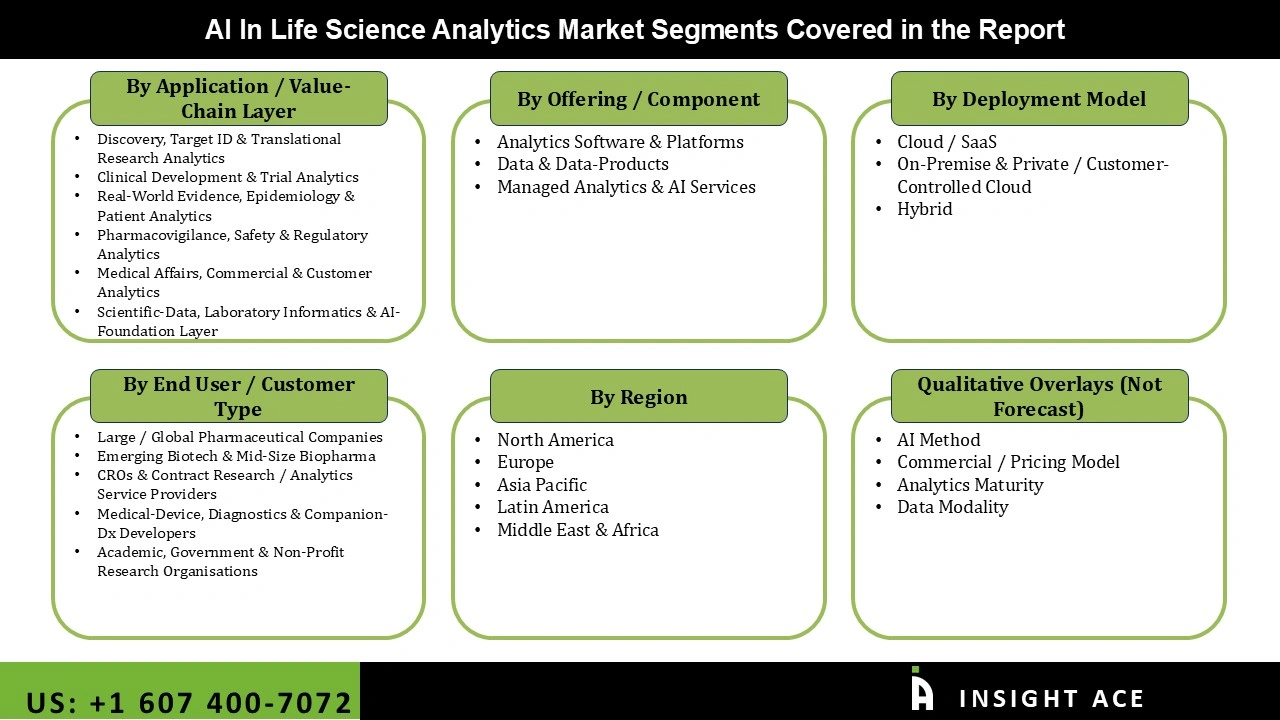
AI In Life Science Analytics Market, By Offering / Component-
- Analytics Software & Platforms
- Data & Data-Products
- Managed Analytics & AI Services
AI In Life Science Analytics Market, By Deployment Model-
- Cloud / SaaS
- On-Premise & Private / Customer-Controlled Cloud
- Hybrid
AI In Life Science Analytics Market, By End User / Customer Type-
- Large / Global Pharmaceutical Companies
- Emerging Biotech & Mid-Size Biopharma
- CROs & Contract Research / Analytics Service Providers
- Medical-Device, Diagnostics & Companion-Dx Developers
- Academic, Government & Non-Profit Research Organisations
AI In Life Science Analytics Market, By Region-
- North America-
- The US
- Canada
- Europe-
- Germany
- The UK
- France
- Italy
- Spain
- Rest of Europe
- Asia-Pacific-
- China
- Japan
- India
- South Korea
- South East Asia
- Rest of Asia Pacific
- Latin America-
- Brazil
- Argentina
- Mexico
- Rest of Latin America
- Middle East & Africa-
- GCC Countries
- South Africa
- Rest of Middle East and Africa
Chapter 1. Methodology and Scope
1.1. Research Methodology
1.2. Research Scope & Assumptions
1.3. Market Definition and Revenue Boundary
1.4. Inclusions and Exclusions
1.5. Single-Count Rule — Application / Value-Chain Layer as the Core Sizing Axis
Chapter 2. Executive Summary
Chapter 3. Global AI In Life Science Analytics Market Snapshot
Chapter 4. Global AI In Life Science Analytics Market Variables, Trends & Scope
4.1. Market Segmentation & Scope
4.2. Drivers
4.3. Challenges
4.4. Trends
4.5. Investment, Partnership and Funding Analysis
4.6. Porter’s Five Forces Analysis
4.7. Incremental Opportunity Analysis (US$ Mn), 2026-2035
4.8. Global AI In Life Science Analytics Market Penetration & Growth Prospect Mapping (US$ Mn), 2025-2035
4.9. Competitive Landscape & Market Share Analysis, By Key Player (2025)
4.10. Data-Governance, Privacy and Regulatory Context for AI in Life-Science Analytics
Chapter 5. AI In Life Science Analytics Market Segmentation 1: By Application / Value-Chain Layer, Estimates & Trend Analysis
5.1. Market Share by Application / Value-Chain Layer, 2025 & 2035
5.2. Market Size (Value US$ Mn) & Forecasts and Trend Analyses, 2022–2024 Historical, 2025 Base, 2026–2035 Forecast, for the following Application / Value-Chain Layer:
5.2.1. Discovery, Target ID & Translational Research Analytics
5.2.1.1. Target & Biomarker Identification, Ranking & Tractability
5.2.1.2. Generative Molecular Design & Predictive Screening
5.2.1.3. Scientific & Evidence Intelligence
5.2.1.4. Translational, Multi-Omics & Precision-Medicine Analytics
5.2.2. Clinical Development & Trial Analytics
5.2.2.1. Trial Design, Feasibility & Site / Investigator Selection
5.2.2.2. Patient Recruitment, Enrolment Forecasting & Diversity
5.2.2.3. Clinical Data Management, Review & Centralised / Risk-Based Monitoring
5.2.2.4. Digital Twins, Synthetic & External Control Arms
5.2.3. Real-World Evidence, Epidemiology & Patient Analytics
5.2.3.1. RWD Curation, Tokenisation & Linkage
5.2.3.2. Epidemiology, Patient-Journey & HEOR Analytics
5.2.3.3. Regulatory-Grade RWE, Comparative Effectiveness & Post-Market Safety
5.2.4. Pharmacovigilance, Safety & Regulatory Analytics
5.2.4.1. Case Intake, Processing & Automated Assessment
5.2.4.2. Signal Detection & Literature Surveillance
5.2.4.3. Regulatory Information Management & Submission Intelligence
5.2.5. Medical Affairs, Commercial & Customer Analytics
5.2.5.1. Commercial Analytics, Forecasting & Market Access
5.2.5.2. Field-Force, Territory & Incentive-Compensation Analytics
5.2.5.3. Omnichannel Next-Best-Action & Customer Engagement
5.2.5.4. Medical Affairs & Competitive Intelligence
5.2.6. Scientific-Data, Laboratory Informatics & AI-Foundation Layer
5.2.6.1. Scientific-Data Management & Instrument / Lab-Data Engineering
5.2.6.2. Ontologies, Semantic Enrichment & Knowledge Graphs
5.2.6.3. Omics & Bioinformatics Data Platforms
Chapter 6. AI In Life Science Analytics Market Segmentation 2: By Offering / Component, Estimates & Trend Analysis
6.1. Market Share by Offering / Component, 2025 & 2035
6.2. Market Size (Value US$ Mn) & Forecasts and Trend Analyses, 2022–2024 Historical, 2025 Base, 2026–2035 Forecast, for the following Offering / Component:
6.2.1. Analytics Software & Platforms
6.2.2. Data & Data-Products
6.2.3. Managed Analytics & AI Services
Chapter 7. AI In Life Science Analytics Market Segmentation 3: By Deployment Model, Estimates & Trend Analysis
7.1. Market Share by Deployment Model, 2025 & 2035
7.2. Market Size (Value US$ Mn) & Forecasts and Trend Analyses, 2022–2024 Historical, 2025 Base, 2026–2035 Forecast, for the following Deployment Model:
7.2.1. Cloud / SaaS
7.2.2. On-Premise & Private / Customer-Controlled Cloud
7.2.3. Hybrid
Chapter 8. AI In Life Science Analytics Market Segmentation 4: By End User / Customer Type, Estimates & Trend Analysis
8.1. Market Share by End User / Customer Type, 2025 & 2035
8.2. Market Size (Value US$ Mn) & Forecasts and Trend Analyses, 2022–2024 Historical, 2025 Base, 2026–2035 Forecast, for the following End User / Customer Type:
8.2.1. Large / Global Pharmaceutical Companies
8.2.2. Emerging Biotech & Mid-Size Biopharma
8.2.3. CROs & Contract Research / Analytics Service Providers
8.2.4. Medical-Device, Diagnostics & Companion-Dx Developers
8.2.5. Academic, Government & Non-Profit Research Organisations
Chapter 9. AI In Life Science Analytics Market Segmentation 5: Regional Estimates & Trend Analysis
9.1. Global AI In Life Science Analytics Market, Regional Snapshot 2025 & 2035
9.2. North America
9.2.1. North America Market Revenue (US$ Mn) Estimates and Forecasts by Country, 2022-2035
9.2.1.1. United States
9.2.1.2. Canada
9.2.2. North America Market Revenue (US$ Mn) Estimates and Forecasts by Application / Value-Chain Layer, 2022-2035
9.2.3. North America Market Revenue (US$ Mn) Estimates and Forecasts by Offering / Component, 2022-2035
9.2.4. North America Market Revenue (US$ Mn) Estimates and Forecasts by Deployment Model, 2022-2035
9.2.5. North America Market Revenue (US$ Mn) Estimates and Forecasts by End User / Customer Type, 2022-2035
9.3. Europe
9.3.1. Europe Market Revenue (US$ Mn) Estimates and Forecasts by Country, 2022-2035
9.3.1.1. Germany
9.3.1.2. United Kingdom
9.3.1.3. France
9.3.1.4. Italy
9.3.1.5. Spain
9.3.1.6. Switzerland
9.3.1.7. Netherlands
9.3.1.8. Rest of Europe
9.3.2. Europe Market Revenue (US$ Mn) Estimates and Forecasts by Application / Value-Chain Layer, 2022-2035
9.3.3. Europe Market Revenue (US$ Mn) Estimates and Forecasts by Offering / Component, 2022-2035
9.3.4. Europe Market Revenue (US$ Mn) Estimates and Forecasts by Deployment Model, 2022-2035
9.3.5. Europe Market Revenue (US$ Mn) Estimates and Forecasts by End User / Customer Type, 2022-2035
9.4. Asia Pacific
9.4.1. Asia Pacific Market Revenue (US$ Mn) Estimates and Forecasts by Country, 2022-2035
9.4.1.1. China
9.4.1.2. Japan
9.4.1.3. India
9.4.1.4. South Korea
9.4.1.5. Australia
9.4.1.6. Singapore
9.4.1.7. Rest of APAC
9.4.2. Asia Pacific Market Revenue (US$ Mn) Estimates and Forecasts by Application / Value-Chain Layer, 2022-2035
9.4.3. Asia Pacific Market Revenue (US$ Mn) Estimates and Forecasts by Offering / Component, 2022-2035
9.4.4. Asia Pacific Market Revenue (US$ Mn) Estimates and Forecasts by Deployment Model, 2022-2035
9.4.5. Asia Pacific Market Revenue (US$ Mn) Estimates and Forecasts by End User / Customer Type, 2022-2035
9.5. Latin America
9.5.1. Latin America Market Revenue (US$ Mn) Estimates and Forecasts by Country, 2022-2035
9.5.1.1. Brazil
9.5.1.2. Mexico
9.5.1.3. Rest of Latin America
9.5.2. Latin America Market Revenue (US$ Mn) Estimates and Forecasts by Application / Value-Chain Layer, 2022-2035
9.5.3. Latin America Market Revenue (US$ Mn) Estimates and Forecasts by Offering / Component, 2022-2035
9.5.4. Latin America Market Revenue (US$ Mn) Estimates and Forecasts by Deployment Model, 2022-2035
9.5.5. Latin America Market Revenue (US$ Mn) Estimates and Forecasts by End User / Customer Type, 2022-2035
9.6. Middle East & Africa
9.6.1. Middle East & Africa Market Revenue (US$ Mn) Estimates and Forecasts by Country, 2022-2035
9.6.1.1. GCC Countries
9.6.1.2. Israel
9.6.1.3. South Africa
9.6.1.4. Rest of MEA
9.6.2. Middle East & Africa Market Revenue (US$ Mn) Estimates and Forecasts by Application / Value-Chain Layer, 2022-2035
9.6.3. Middle East & Africa Market Revenue (US$ Mn) Estimates and Forecasts by Offering / Component, 2022-2035
9.6.4. Middle East & Africa Market Revenue (US$ Mn) Estimates and Forecasts by Deployment Model, 2022-2035
9.6.5. Middle East & Africa Market Revenue (US$ Mn) Estimates and Forecasts by End User / Customer Type, 2022-2035
Chapter 10. Qualitative Overlays (Analysed, Not Forecast as Revenue Axes)
10.1. By AI Method
10.1.1. ML / Predictive
10.1.2. Generative / LLM
10.1.3. Agentic
10.1.4. Knowledge-Graph & NLP
10.1.5. Computer Vision
10.1.6. Physics-Hybrid
10.2. By Commercial / Pricing Model
10.2.1. Subscription
10.2.2. Consumption
10.2.3. Perpetual
10.2.4. Outcome-Based
10.2.5. Data-Licensing
10.3. By Analytics Maturity
10.3.1. Descriptive
10.3.2. Predictive
10.3.3. Generative
10.3.4. Agentic
10.4. By Data Modality
10.4.1. Omics / Genomic
10.4.2. Clinical / EHR
10.4.3. Imaging / Pathology
10.4.4. Real-World / Claims
10.4.5. Scientific Text
10.4.6. Lab / Instrument
10.5. Why These Dimensions Are Not Value-Forecast
Chapter 11. Competitive Landscape
11.1. Major Mergers, Acquisitions & Strategic Alliances
11.2. Company Profiles — Broad Enterprise & End-to-End Platforms
11.2.1. IQVIA
11.2.1.1. Business Overview
11.2.1.2. Key Product/Service
11.2.1.3. Financial Performance
11.2.1.4. Geographical Presence
11.2.1.5. Recent Developments with Business Strategy
11.2.2. Veeva Systems
11.2.3. Oracle Life Sciences
11.2.4. Medidata (Dassault Systèmes)
11.2.5. SAS Institute
11.3. Company Profiles — AI-Native Discovery, Translational & Scientific-Intelligence
11.3.1. Tempus AI
11.3.2. Owkin
11.3.3. Causaly
11.3.4. BenchSci
11.3.5. Insilico Medicine
11.3.6. Recursion Pharmaceuticals
11.3.7. Schrödinger
11.3.8. PathAI (Roche, acquisition pending)
11.4. Company Profiles — Clinical-Development & Trial-Analytics Specialists
11.4.1. Saama Technologies
11.4.2. Unlearn.AI
11.5. Company Profiles — Real-World Evidence & Patient-Analytics Leaders
11.5.1. Komodo Health
11.5.2. Datavant
11.5.3. Flatiron Health (Roche)
11.5.4. ConcertAI
11.6. Company Profiles — Scientific-Data, Laboratory Informatics & AI-Foundation Layer
11.6.1. TetraScience
11.6.2. Dotmatics (Siemens)
11.6.3. SciBite (Elsevier / RELX)
11.6.4. DNAnexus
11.6.5. SOPHiA GENETICS
11.7. Company Profiles — Pharmacovigilance, Safety, Regulatory & Medical Specialists
11.7.1. ArisGlobal
11.8. Company Profiles — Commercial, Medical-Affairs & Customer-Analytics Players
11.8.1. ZS Associates (ZAIDYN)
11.8.2. Axtria
11.8.3. Aktana
11.9. Horizontal Enablers & Adjacencies (Expanded Lens Only — Not in Core)
11.9.1. Databricks
11.9.2. Snowflake
11.9.3. Microsoft
11.9.4. Palantir
11.9.5. NVIDIA
11.9.6. Merative
11.10. Consolidated / Former Names — Not Counted Separately
11.10.1. Exscientia — counted under Recursion Pharmaceuticals
11.10.2. Aetion — counted under Datavant
11.10.3. Paige — counted under Tempus AI
Research Design and Approach
This study employed a multi-step, mixed-method research approach that integrates:
- Secondary research
- Primary research
- Data triangulation
- Hybrid top-down and bottom-up modelling
- Forecasting and scenario analysis
This approach ensures a balanced and validated understanding of both macro- and micro-level market factors influencing the market.
Secondary Research
Secondary research for this study involved the collection, review, and analysis of publicly available and paid data sources to build the initial fact base, understand historical market behaviour, identify data gaps, and refine the hypotheses for primary research.
Sources Consulted
Secondary data for the market study was gathered from multiple credible sources, including:
- Government databases, regulatory bodies, and public institutions
- International organizations (WHO, OECD, IMF, World Bank, etc.)
- Commercial and paid databases
- Industry associations, trade publications, and technical journals
- Company annual reports, investor presentations, press releases, and SEC filings
- Academic research papers, patents, and scientific literature
- Previous market research publications and syndicated reports
These sources were used to compile historical data, market volumes/prices, industry trends, technological developments, and competitive insights.
Primary Research
Primary research was conducted to validate secondary data, understand real-time market dynamics, capture price points and adoption trends, and verify the assumptions used in the market modelling.
Stakeholders Interviewed
Primary interviews for this study involved:
- Manufacturers and suppliers in the market value chain
- Distributors, channel partners, and integrators
- End-users / customers (e.g., hospitals, labs, enterprises, consumers, etc., depending on the market)
- Industry experts, technology specialists, consultants, and regulatory professionals
- Senior executives (CEOs, CTOs, VPs, Directors) and product managers
Interview Process
Interviews were conducted via:
- Structured and semi-structured questionnaires
- Telephonic and video interactions
- Email correspondences
- Expert consultation sessions
Primary insights were incorporated into demand modelling, pricing analysis, technology evaluation, and market share estimation.
Data Processing, Normalization, and Validation
All collected data were processed and normalized to ensure consistency and comparability across regions and time frames.
The data validation process included:
- Standardization of units (currency conversions, volume units, inflation adjustments)
- Cross-verification of data points across multiple secondary sources
- Normalization of inconsistent datasets
- Identification and resolution of data gaps
- Outlier detection and removal through algorithmic and manual checks
- Plausibility and coherence checks across segments and geographies
This ensured that the dataset used for modelling was clean, robust, and reliable.
Market Size Estimation and Data Triangulation
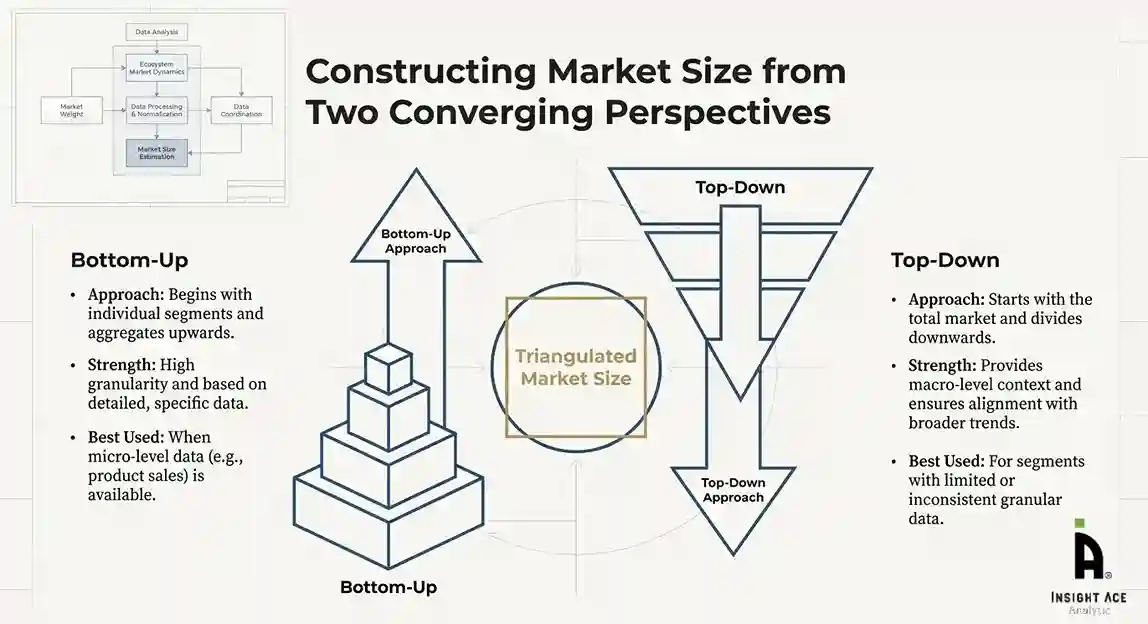
Bottom-Up Approach
The bottom-up approach involved aggregating segment-level data, such as:
- Company revenues
- Product-level sales
- Installed base/usage volumes
- Adoption and penetration rates
- Pricing analysis
This method was primarily used when detailed micro-level market data were available.
Top-Down Approach
The top-down approach used macro-level indicators:
- Parent market benchmarks
- Global/regional industry trends
- Economic indicators (GDP, demographics, spending patterns)
- Penetration and usage ratios
This approach was used for segments where granular data were limited or inconsistent.
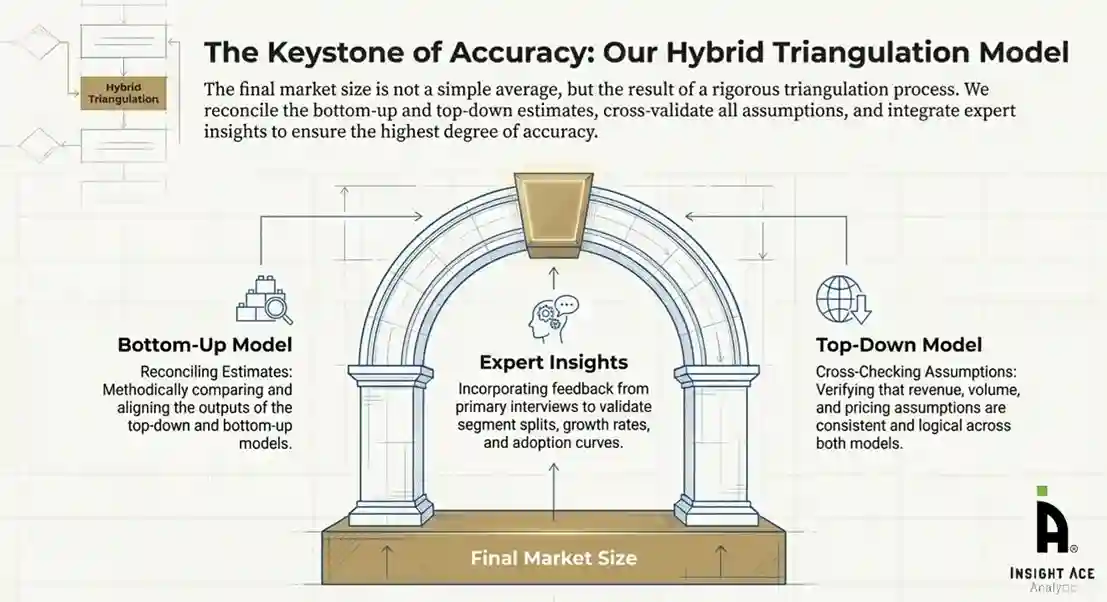
Hybrid Triangulation Approach
To ensure accuracy, a triangulated hybrid model was used. This included:
- Reconciling top-down and bottom-up estimates
- Cross-checking revenues, volumes, and pricing assumptions
- Incorporating expert insights to validate segment splits and adoption rates
This multi-angle validation yielded the final market size.
Forecasting Framework and Scenario Modelling
Market forecasts were developed using a combination of time-series modelling, adoption curve analysis, and driver-based forecasting tools.
Forecasting Methods
- Time-series modelling
- S-curve and diffusion models (for emerging technologies)
- Driver-based forecasting (GDP, disposable income, adoption rates, regulatory changes)
- Price elasticity models
- Market maturity and lifecycle-based projections
Scenario Analysis
Given inherent uncertainties, three scenarios were constructed:
- Base-Case Scenario: Expected trajectory under current conditions
- Optimistic Scenario: High adoption, favourable regulation, strong economic tailwinds
- Conservative Scenario: Slow adoption, regulatory delays, economic constraints
Sensitivity testing was conducted on key variables, including pricing, demand elasticity, and regional adoption.
Request Customization
Add countries, segments, company profiles, or extend forecast — free 10% customization with purchase.
Customize This Report →Enquire Before Buying
Speak with our analyst team about scope, methodology, pricing, or deliverable formats.
Enquire Now →Frequently Asked Questions
AI In Life Science Analytics Market Size is valued at USD 1.80 Bn in 2025 and is predicted to reach USD 4.84 Bn by the year 2035
AI In Life Science Analytics Market is expected to grow at a 10.5% CAGR during the forecast period for 2026 to 2035.
IQVIA, Veeva Systems, Oracle Life Sciences, Medidata (Dassault Systèmes), SAS Institute, Tempus AI, Owkin, Causaly, BenchSci, Insilico Medicine, Recursion Pharmaceuticals, Schrödinger, PathAI, Saama Technologies, Unlearn.AI, Komodo Health, Datavant, Flatiron Health, ConcertAI, TetraScience, Dotmatics, SciBite, DNAnexus, SOPHiA GENETICS, ArisGlobal, ZS Associates, Axtria, Aktana, Databricks, Snowflake, Microsoft, Palantir, NVIDIA, Merative, Exscientia, Aetion, Paige and Others.
AI In Life Science Analytics Market is segmented into Application , Offering, Deployment Model, End User and Other.
North America region is leading the AI In Life Science Analytics Market.