Therapeutic Plasma Exchange Market is expected to grow at an 5.5% CAGR during the forecast period for 2025-2034.

Plasma exchange is a biological procedure that removes large-molecular-weight substances such as harmful antibodies from the plasma. In this procedure, a large portion of plasma containing abnormal matter and toxins are removed from the components of WBCs, RBCs, and platelets and then replaced with replacement fluid, like fresh frozen plasma (FFP) i.e., donor plasma or albumin. It is performed to treat several chronic diseases as the first-line or as second line of treatment therapy in neurological and non-neurological conditions.
Therapeutic plasma exchange (TPE) can rapidly decrease plasma viscosity. Thus, it can improve patient outcomes in critically ill patients with COVID-19 by reducing plasma viscosity and thereby enhancing blood flow.
Global Therapeutic plasma exchange market is expected to offer the lucrative growth in the near future due to the rising prevalence of chronic diseases and ongoing research and clinical trials to determine the efficacy of plasma exchange over other treatments. Also, the outbreak of a new viral disease, COVID – 19, is also creating a massive demand for therapeutic plasma exchange and thereby drive the global market.
The Global Therapeutic plasma exchange market is segmented on the basis of product & technologies, end-users, and region. Based on the base of product and technology, the market is divided into the product (consumables & devices) and technology (centrifugation & membrane separation). On the basis of indication, the market is divided into neurological disorders, hematology disorders, renal disorders, and metabolic disorders. On the basis of end-users, the market is divided into blood collection centres & blood component providers, hospitals & transfusion centres, and other end users. Based on region, the market is studied across North America, Asia-Pacific, Europe, and LAMEA. North America accounted for the largest share of the market in 2019, followed by Europe and Asia Pacific. On the other hand, the Asia Pacific is projected to have the highest growth rate during the forecast period.
| Report Attribute | Specifications |
| Growth Rate CAGR | CAGR of 5.5% from 2025 to 2034 |
| Quantitative Units | Representation of revenue in US$ Million and CAGR from 2025 to 2034 |
| Historic Year | 2021 to 2024 |
| Forecast Year | 2025-2034 |
| Report Coverage | The forecast of revenue, the position of the company, the competitive market structure, growth prospects, and trends |
| Segments Covered | By Product & Technologies, By Indication, By End-Users |
| Regional Scope | North America; Europe; Asia Pacific; Latin America; Middle East & Africa |
| Country Scope | U.S.; Canada; U.K.; Germany; China; India; Japan; Brazil; Mexico; The UK; France; Italy; Spain; South Korea; South East Asia |
| Competitive Landscape | Terumo BCT, Inc., Fresenius SE & Co. KGaA, Haemonetics Corporation, Asahi Kasei Medical Co. Ltd., B. Braun Melsungen AG, Baxter International Inc., Cerus Corporation, Kaneka Corporation, Kawasumi Laboratories, Inc., Nikkiso Co., Ltd., Miltenyi Biotec, Medica S.p.A., Medicap Clinic GmbH, and Others |
| Customization Scope | Free customization report with the procurement of the report, Modifications to the regional and segment scope. Particular Geographic competitive landscape. |
| Pricing and Available Payment Methods | Explore pricing alternatives that are customized to your particular study requirements. |
Global Therapeutic Plasma Exchange Market Revenue (US$ Mn), by Product & Technology,

Global Therapeutic Plasma Exchange Market Revenue (US$ Mn), By Indication,
Global Therapeutic Plasma Exchange Market Revenue (US$ Mn), By End Users,
Global Therapeutic Plasma Exchange Market Revenue (US$ Mn), By Region,
North America Therapeutic Plasma Exchange Market Revenue (US$ Mn), by Country,
Europe Therapeutic Plasma Exchange Market Revenue (US$ Mn), by Country,
Asia Pacific Therapeutic Plasma Exchange Market Revenue (US$ Mn), by Country,
Latin America Therapeutic Plasma Exchange Market Revenue (US$ Mn), by Country, 2019-2030
Middle East & Africa Therapeutic Plasma Exchange Market Revenue (US$ Mn), by Country, 2019-2030
This study employed a multi-step, mixed-method research approach that integrates:
This approach ensures a balanced and validated understanding of both macro- and micro-level market factors influencing the market.
Secondary research for this study involved the collection, review, and analysis of publicly available and paid data sources to build the initial fact base, understand historical market behaviour, identify data gaps, and refine the hypotheses for primary research.
Secondary data for the market study was gathered from multiple credible sources, including:
These sources were used to compile historical data, market volumes/prices, industry trends, technological developments, and competitive insights.
Primary research was conducted to validate secondary data, understand real-time market dynamics, capture price points and adoption trends, and verify the assumptions used in the market modelling.
Primary interviews for this study involved:
Interviews were conducted via:
Primary insights were incorporated into demand modelling, pricing analysis, technology evaluation, and market share estimation.
All collected data were processed and normalized to ensure consistency and comparability across regions and time frames.
The data validation process included:
This ensured that the dataset used for modelling was clean, robust, and reliable.
The bottom-up approach involved aggregating segment-level data, such as:
This method was primarily used when detailed micro-level market data were available.
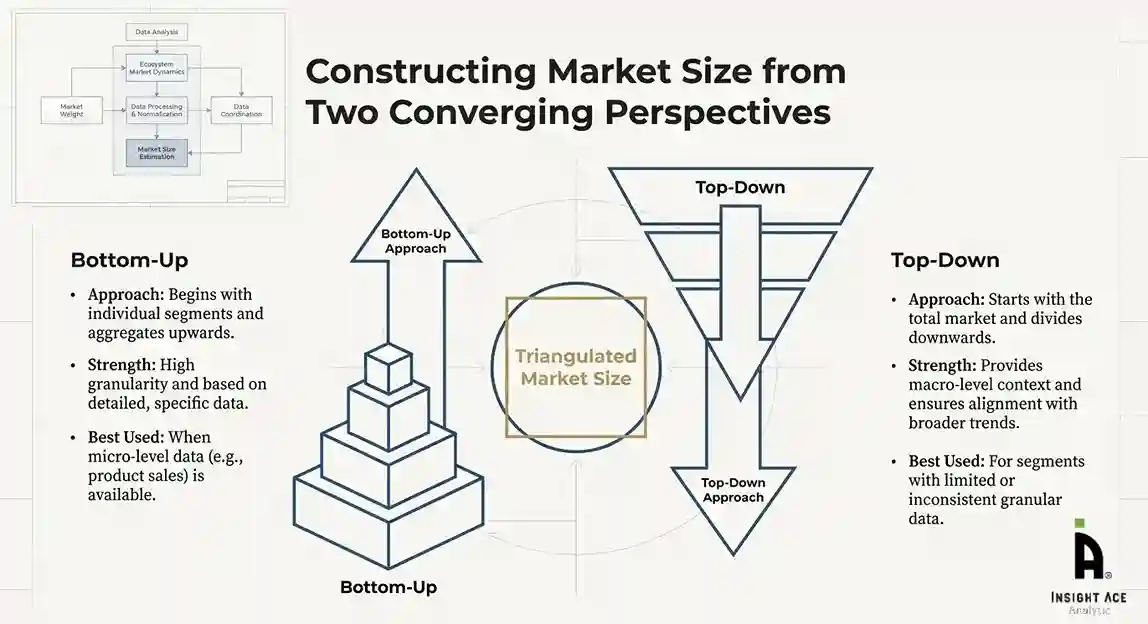
The top-down approach used macro-level indicators:
This approach was used for segments where granular data were limited or inconsistent.
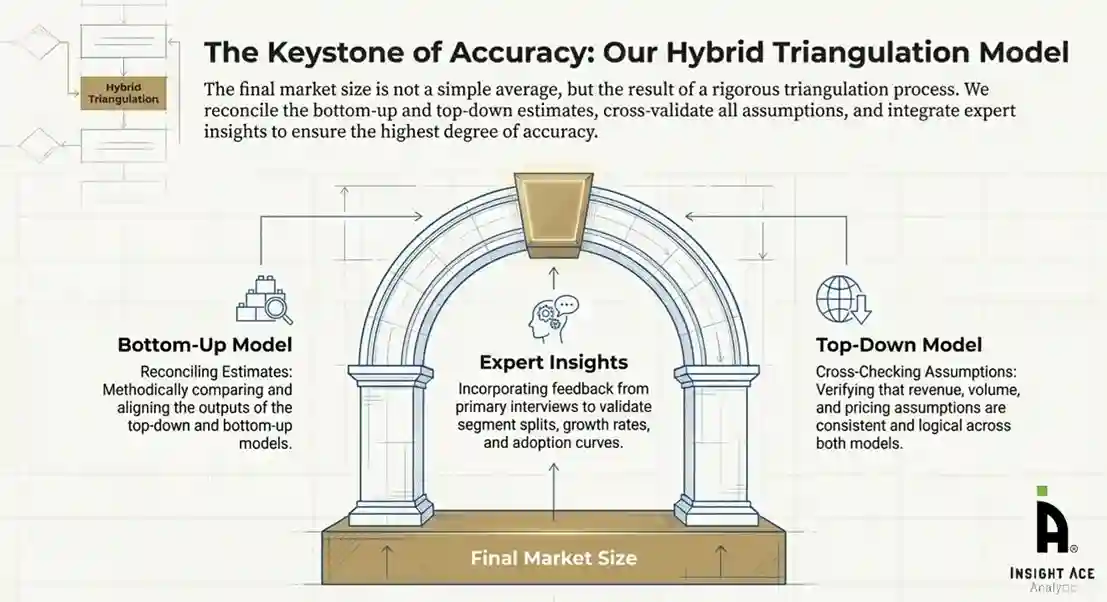
To ensure accuracy, a triangulated hybrid model was used. This included:
This multi-angle validation yielded the final market size.
Market forecasts were developed using a combination of time-series modelling, adoption curve analysis, and driver-based forecasting tools.
Given inherent uncertainties, three scenarios were constructed:
Sensitivity testing was conducted on key variables, including pricing, demand elasticity, and regional adoption.