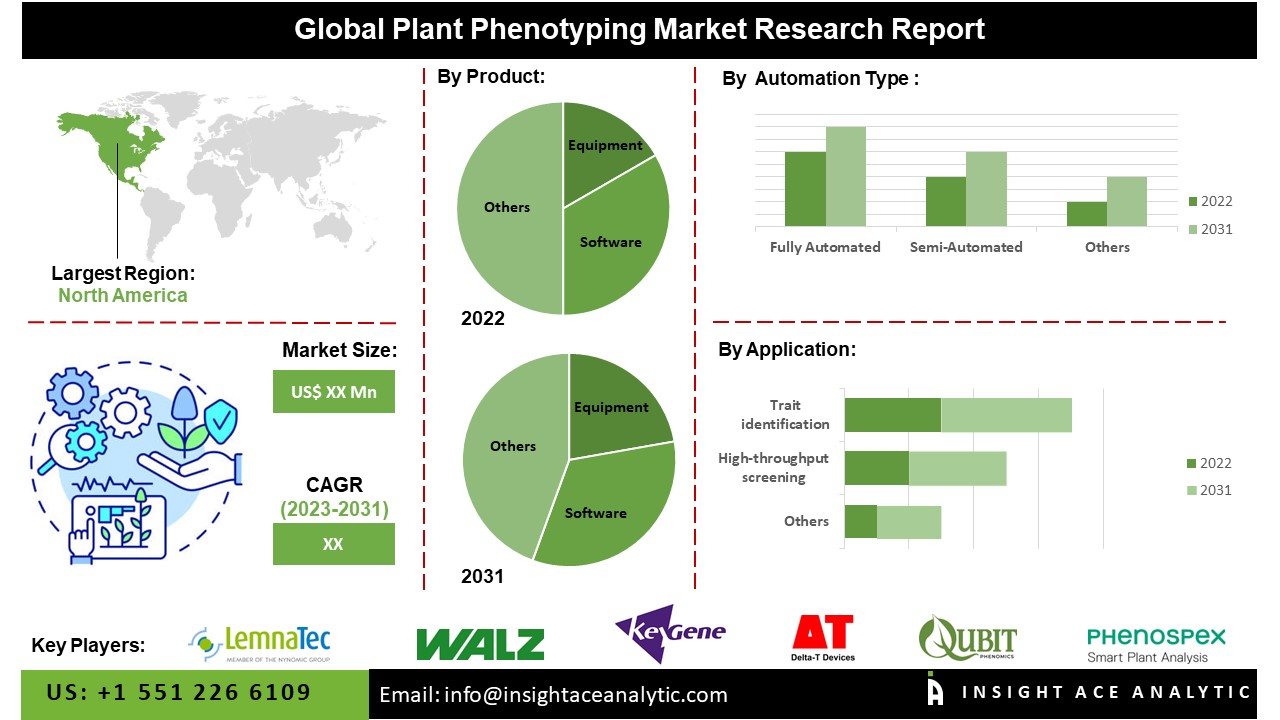
The Global Plant Phenotyping Market Size is valued at 236.13 million in 2022 and is predicted to reach 640.89 million by the year 2031 at a 11.93% CAGR during the forecast period for 2023-2031.
The need for high-yielding crops to meet food security requirements has been driven by the growing population, which is, in turn, driving demand for novel plant breeding strategies to increase crop productivity. Global warming and the augmented frequency of extreme weather events are also increasing the demand for crop yield, boosting the phenotyping market.

Additionally, improvements in imaging technology provide a better evaluation of plant traits enabling the creation of improved crop breeds fit for the specific area. By employing various technologies, such as imaging spectroscopy, infrared imaging, fluorescence imaging, and visible light imaging, whose data sorts from macroscopic to molecular scale, imaging techniques help detect optical features of plants.
Increased research and development initiatives, as well as an increasing trend of commercial plant breeders and plant-based science research organizations using plant phenotyping services, are driving market expansion.
Also, the demand for high-throughput phenotyping platforms to be used in greenhouses is a significant contributor to market expansion. Computing facilitates the creation of field-based platforms and controlled environment-based phenotyping platforms by fusing advances in aeronautics, autonomous control technology, and sensing technologies. Recent years have seen the commercial sale and implementation of controlled environment-based phenotyping technologies in greenhouses.
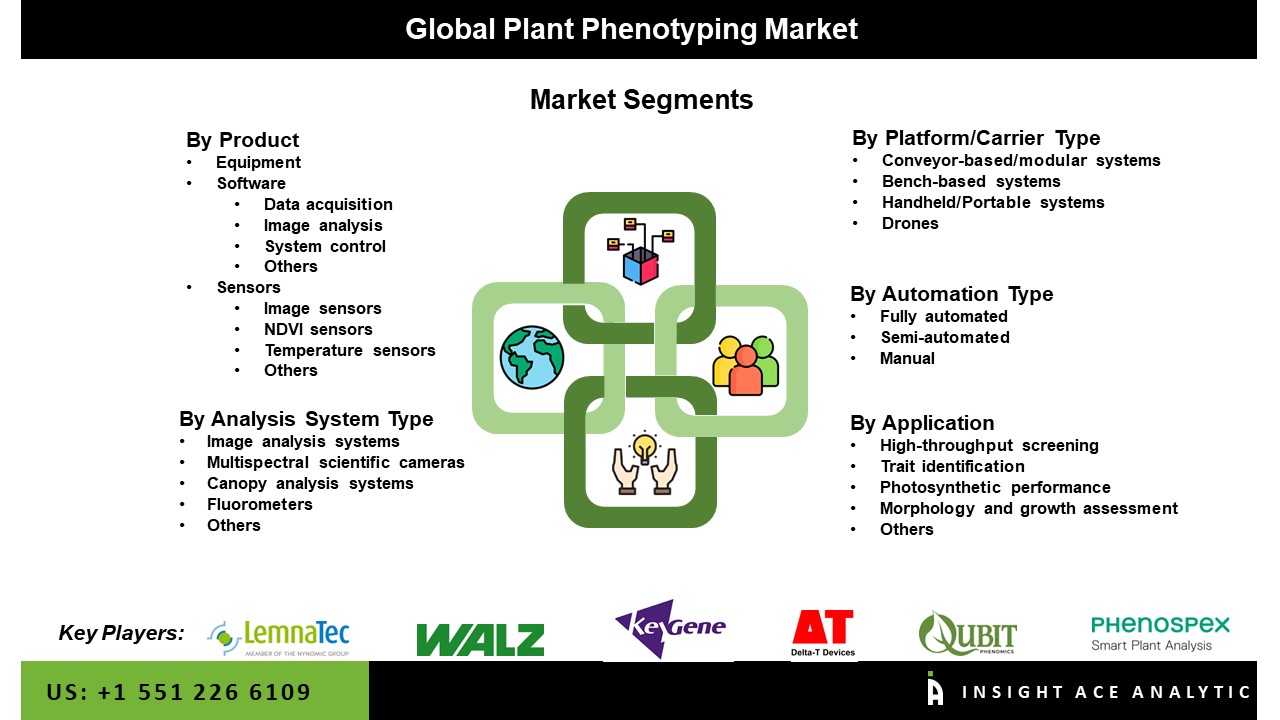
The plant phenotyping market is segmented based on product. Based on product, the market is segmented into Equipment, Software (Data Acquisition, Image Analysis, System Control, and Others), and Sensors (Image Sensors, NDVI Sensors, Temperature Sensors, and Others). Platform/Carrier type segment includes Conveyor-Based/Modular Systems, Bench-Based Systems, Handheld/Portable Systems, and Drones. The automation Type segment includes Fully Automated, Semi-Automated, and Manual. Analysis System Type segment includes Image Analysis Systems, Multispectral Scientific Cameras, Canopy Analysis Systems, Fluorometers, and Others. The application segment comprises High-Throughput Screening, Trait Identification, Photosynthetic Performance, Morphology and Growth Assessment.
The North American, Plant Phenotyping Market, is predicted to register the highest market share in revenue in the near future. This can be attributed to more government and industry players taking the initiative to develop new technology. The creation of associations like the North American Plant Phenotyping Network (NAPPN), a group of researchers and scientists seeking to accelerate research and development, is one of these initiatives. Europe started the European Plant Phenotyping Project (EPPN) to build a phenotyping infrastructure in the area. The network consists of initiatives including the UK Plant Phenomics Network, the French Plant Phenotyping Network (FPPN), the International Plant Phenotyping Network (IPPN), and the Deutsches Pflanzen Phänotypisierungs Netzwerk (DPPN).
| Report Attribute | Specifications |
| Market size value in 2022 | USD 236.13 Mn |
| Revenue forecast in 2031 | USD 640.89 Mn |
| Growth rate CAGR | CAGR of 11.93 % from 2023 to 2031 |
| Quantitative units | Representation of revenue in US$ Billion, and CAGR from 2023 to 2031 |
| Historic Year | 2019 to 2022 |
| Forecast Year | 2023-2031 |
| Report coverage | The forecast of revenue, the position of the company, the competitive market statistics, growth prospects, and trends |
| Segments covered | Products, Platform, Automation Type, Analysis System Type And Application |
| Regional scope | North America; Europe; Asia Pacific; Latin America; Middle East & Africa |
| Country scope | U.S.; Canada; U.K.; Germany; China; India; Japan; Brazil; Mexico; The UK; France; Italy; Spain; China; Japan; India; South Korea; Southeast Asia; South Korea; Southeast Asia |
| Competitive Landscape | Lemnatec (Nynomic Ag), Delta-T Devices Ltd., Heinz Walz Gmbh, Phenospex, Keygene, Phenomix, Cropdesign, Qubit Systems Inc., Photon Systems Instruments, Wps B.V., Wiwam, Rothamsted Research Limited, Vbcf, Plant Ditech, Bex, Co. Ltd. |
| Customization scope | Free customization report with the procurement of the report, Modifications to the regional and segment scope. Particular Geographic competitive landscape. |
| Pricing and available payment methods | Explore pricing alternatives that are customized to your particular study requirements. |
Plant Phenotyping Market By Product-

Plant Phenotyping Market By Platform/Carrier Type:
Plant Phenotyping Market By Automation Type:
Plant Phenotyping Market By Analysis System Type:
Plant Phenotyping Market By Application:
Plant Phenotyping Market By Region-
North America-
Europe-
Asia-Pacific-
Latin America-
Middle East & Africa-
This study employed a multi-step, mixed-method research approach that integrates:
This approach ensures a balanced and validated understanding of both macro- and micro-level market factors influencing the market.
Secondary research for this study involved the collection, review, and analysis of publicly available and paid data sources to build the initial fact base, understand historical market behaviour, identify data gaps, and refine the hypotheses for primary research.
Secondary data for the market study was gathered from multiple credible sources, including:
These sources were used to compile historical data, market volumes/prices, industry trends, technological developments, and competitive insights.

Primary research was conducted to validate secondary data, understand real-time market dynamics, capture price points and adoption trends, and verify the assumptions used in the market modelling.
Primary interviews for this study involved:
Interviews were conducted via:
Primary insights were incorporated into demand modelling, pricing analysis, technology evaluation, and market share estimation.
All collected data were processed and normalized to ensure consistency and comparability across regions and time frames.
The data validation process included:
This ensured that the dataset used for modelling was clean, robust, and reliable.
The bottom-up approach involved aggregating segment-level data, such as:
This method was primarily used when detailed micro-level market data were available.

The top-down approach used macro-level indicators:
This approach was used for segments where granular data were limited or inconsistent.
To ensure accuracy, a triangulated hybrid model was used. This included:
This multi-angle validation yielded the final market size.
Market forecasts were developed using a combination of time-series modelling, adoption curve analysis, and driver-based forecasting tools.
Given inherent uncertainties, three scenarios were constructed:
Sensitivity testing was conducted on key variables, including pricing, demand elasticity, and regional adoption.