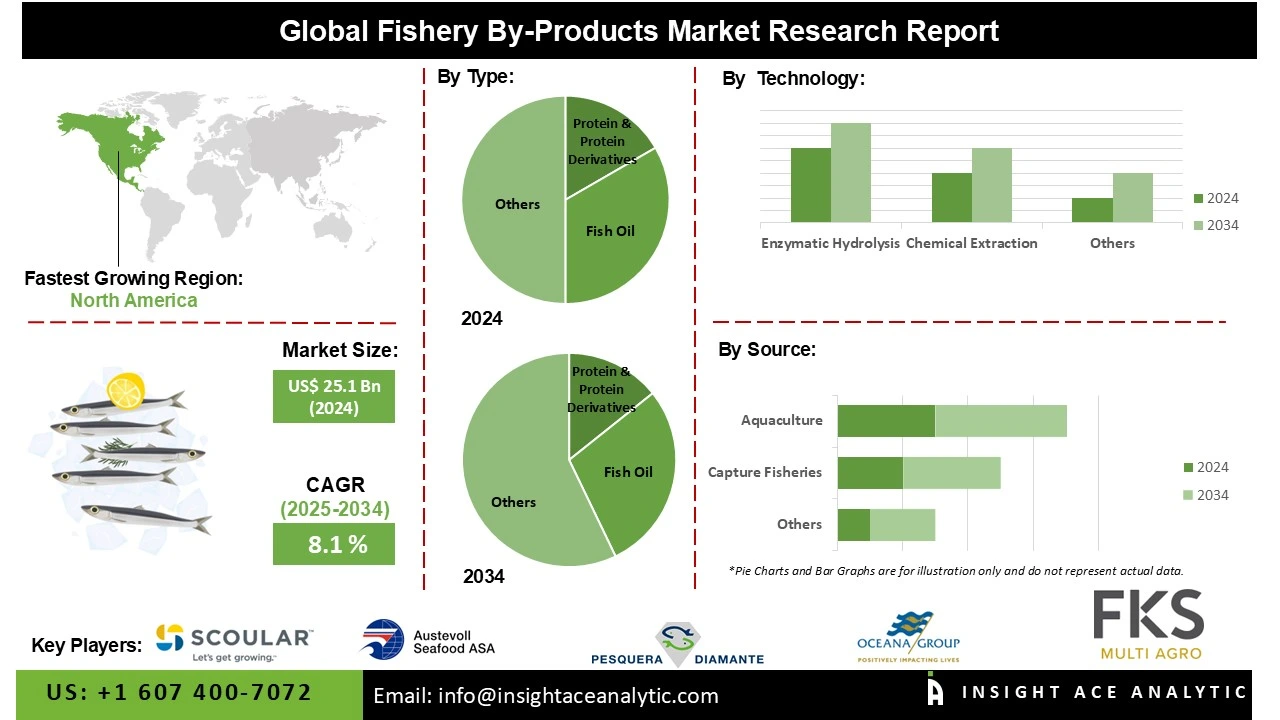
Global Fishery By-products Market Size is valued at US$ 25.1 Bn in 2024 and is predicted to reach US$ 52.6 Bn by the year 2034 at an 8.1% CAGR during the forecast period for 2025-2034.
Fishery by-products are the non-primary parts of a fish such as heads, bones, skin, viscera, and scales that remain after processing. Once considered mere waste destined for disposal, these materials are now recognized as a valuable resource. Through modern technology and a "zero-waste" approach, these by-products are transformed into high-value products. This includes nutrient-rich fish oil and protein supplements for human health, collagen for cosmetics, ingredients for animal feed, and even biodegradable materials. Utilizing these by-products reduces environmental pollution, creates new economic opportunities, and maximizes the value derived from every caught fish, making the entire fishing industry more sustainable and efficient.

The growth in aquaculture and animal feed industries is a major factor that is propelling the Fishery By-products market, as fish meal and fish oil from waste are the main sources of proteins and nutrients, thus contributing to the production of sustainable feed and increasing the profitability of the industry.
The rise of the seafood industry through aquaculture, which in turn leads to the demand for animal feed, is the leading factor behind the meteoric expansion of the fishery by-products market. The proteins and lipids in fish meal and fish oil derived from waste offer the required building blocks for sustainable feed production, which results in the profit margin of the industry increasing. The supply of raw materials is inconsistent, due to which the Fishery By-products sector faces difficulties, such as a lack of infrastructure. During the forecast period, the Fishery By-products market will be able to access new markets and customers as a result of its commitment to the circular economy, which includes a growing demand for sustainable products as well as a rise in the pharmaceutical and nutraceutical sectors.
Some of the Key Players in the Fishery By-products Market:
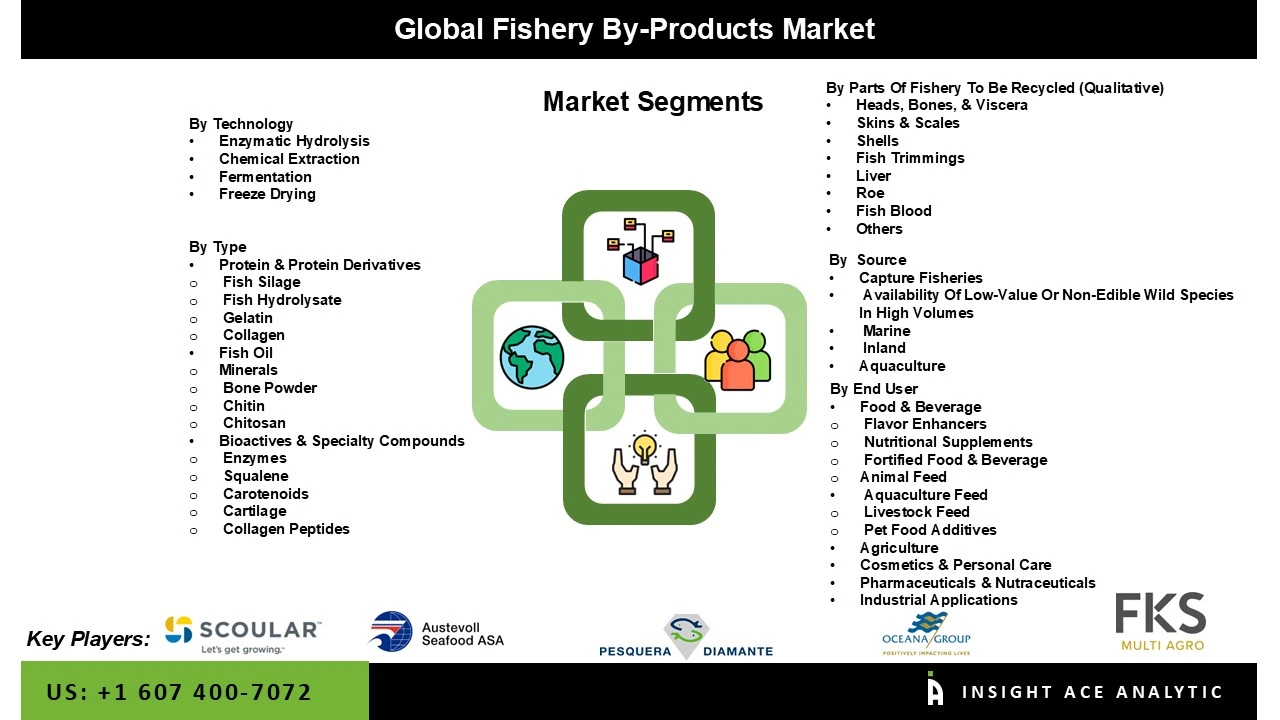
The Fishery By-products market is segmented by Type, Technology, Source, End-Use Industry, and Parts of Fishery to Be Recycled (Qualitative). By Type, the market is segmented into Protein & Protein Derivativeso (Fishmeal, Fish Silage, Fish Hydrolysate, Gelatin, Collagen)
, Fish Oil, Minerals (Bone Powder, Chitin, Chitosan), Bioactives & speciality compounds (Enzymes, Squalene, Carotenoids, Cartilage, Collagen Peptides). By Technology, the market is segmented into Enzymatic Hydrolysis, Chemical Extraction, Fermentation, and Freeze Drying. By Source, the market is segmented into Capture Fisheries and aquaculture. By End-Use Industry, the market is segmented into Food & Beverage (Flavor Enhancers, Nutritional Supplements, Fortified Food & Beverage), Animal Feed (Aquaculture Feed, Livestock Feed, Pet Food Additives), Agriculture, Cosmetics & Personal Care, Pharmaceuticals & Nutraceuticals, and Industrial Applications. By Parts Of Fishery To Be Recycled (Qualitative), the market is segmented into Heads, Bones, & Viscera, Skins & Scales, Shells: Source Of Biopolymers, Fish Trimmings: Foundation For Flavour & Feed, Liver, Roe, Fish Blood, and Others.
The Protein and protein derivatives category led the Fishery By-products market in 2024 due to the wide range of possibilities they offer in aquaculture feed, animal nutrition, pharmaceuticals, and the food industry. Fish proteins are a great source of essential amino acids and, therefore, ideal as high-quality feed ingredients and dietary supplements. The increasing demand for protein hydrolysates, collagen, and gelatin in nutraceutical and cosmetic markets further enhances their significance within the market. Their historical use to improve texture, nutrition, and functionality in food processing also fuels this demand. Lastly, sustainability initiatives to provide full utilisation of fish waste for protein extraction will drive growth in the segment.
The largest and fastest-growing Fishery By-products is enzymatic hydrolysis technology due to its effectiveness, eco-friendliness and nutrition retaining capability of extracted compounds. It is the process of choice for the controlled destruction of fish proteins into peptides and amino acids for pharmaceuticals, nutraceuticals, and animal feed. Enzymatic hydrolysis gives a higher yield, a cleaner product, and less environmental impact than chemical methods. Furthermore, the increasing use of bio-based and green processing technologies in marine waste valorization is a factor that also supports the position of enzymatic hydrolysis as the most preferred method. This is in line with the global trends of sustainability and clean-label products.
Asia Pacific dominated the Fishery By-products market in 2024 because of high fish production, robust aquaculture sector and significant seafood processing in China, India, Japan and Indonesia. Dominance over market is supported by: established supply chain, low labor cost and increasing demand for fish meal, fish oil, nutraceutical products from the region coupled with increased awareness of sustainable utilization of waste or circular economy solutions.
The Fishery By-products market is expanding at the strongest and fastest rate in the European region. There are high demands of Fishery By-products services in the region as a result of severe sustainability regulations, rising investment trends towards circular economy projects and development of biotechnological innovations for waste valorization. Strong emphasis on ecological healthcare, cosmetics and nutraceutical applications from marine resources in the region, along with increasing consumer preference for natural & sustainable products, will attract high market growth and use of fishery waste at an extreme value proposition.
Fishery By-products Market By Type
· Protein & Protein Derivatives
o Fishmeal
o Fish Silage
o Fish Hydrolysate
o Gelatin
o Collagen
· Fish Oil
· Minerals
o Bone Powder
o Chitin
o Chitosan
· Bioactives & Specialty Compounds
o Enzymes
o Squalene
o Carotenoids
o Cartilage
o Collagen Peptides

Fishery By-products Market By Technology
· Enzymatic Hydrolysis
· Chemical Extraction
· Fermentation
· Freeze Drying
Fishery By-products Market By Source
· Capture Fisheries
o Marine
o Inland
· Aquaculture
Fishery By-products Market By End-Use Industry
· Food & Beverage
o Flavor Enhancers
o Nutritional Supplements
o Fortified Food & Beverage
· Animal Feed
o Aquaculture Feed
o Livestock Feed
o Pet Food Additives
· Agriculture
· Cosmetics & Personal Care
· Pharmaceuticals & Nutraceuticals
· Industrial Applications
Fishery By-products Market By Parts Of Fishery To Be Recycled (Qualitative)
· Heads, Bones, & Viscera
· Skins & Scales
· Shells: Source Of Biopolymers
· Fish Trimmings: Foundation For Flavor & Feed
· Liver, Roe, Fish Blood, and Others
Fishery By-products Market by Parts Of Fishery To Be Recycled (Qualitative)-
· Heads, Bones, & Viscera
· Skins & Scales
· Shells: Source Of Biopolymers
· Fish Trimmings: Foundation For Flavor & Feed
· Liver, Roe, Fish Blood, And Others
Fishery By-products Market by Region-
North America-
· The US
· Canada
Europe-
· Germany
· The UK
· France
· Italy
· Spain
· Rest of Europe
Asia-Pacific-
· China
· Japan
· India
· South Korea
· Southeast Asia
· Rest of Asia Pacific
Latin America-
· Brazil
· Argentina
· Mexico
· Rest of Latin America
Middle East & Africa-
· GCC Countries
· South Africa
· Rest of the Middle East and Africa
This study employed a multi-step, mixed-method research approach that integrates:
This approach ensures a balanced and validated understanding of both macro- and micro-level market factors influencing the market.
Secondary research for this study involved the collection, review, and analysis of publicly available and paid data sources to build the initial fact base, understand historical market behaviour, identify data gaps, and refine the hypotheses for primary research.
Secondary data for the market study was gathered from multiple credible sources, including:
These sources were used to compile historical data, market volumes/prices, industry trends, technological developments, and competitive insights.

Primary research was conducted to validate secondary data, understand real-time market dynamics, capture price points and adoption trends, and verify the assumptions used in the market modelling.
Primary interviews for this study involved:
Interviews were conducted via:
Primary insights were incorporated into demand modelling, pricing analysis, technology evaluation, and market share estimation.
All collected data were processed and normalized to ensure consistency and comparability across regions and time frames.
The data validation process included:
This ensured that the dataset used for modelling was clean, robust, and reliable.
The bottom-up approach involved aggregating segment-level data, such as:
This method was primarily used when detailed micro-level market data were available.

The top-down approach used macro-level indicators:
This approach was used for segments where granular data were limited or inconsistent.
To ensure accuracy, a triangulated hybrid model was used. This included:
This multi-angle validation yielded the final market size.
Market forecasts were developed using a combination of time-series modelling, adoption curve analysis, and driver-based forecasting tools.
Given inherent uncertainties, three scenarios were constructed:
Sensitivity testing was conducted on key variables, including pricing, demand elasticity, and regional adoption.