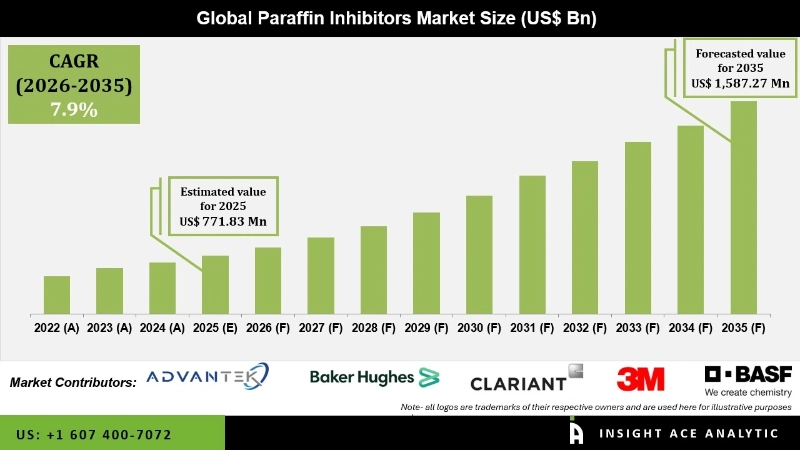
Global Paraffin Inhibitors Market Size is valued at US$ 771.83 Mn in 2025 and is predicted to reach US$ 1,587.27 Mn by the year 2035 at an 7.9% CAGR during the forecast period for 2026-2035.
Paraffin Inhibitors Market Size, Share & Trends Analysis Distribution By Type of Chemistry (EVA Acrylate Copolymer, Hyperbranched Polyester, Modified Polycarboxylate and Poly Acrylate), By Type of Operation (Downstream, Midstream, and Upstream), By Type of Inhibitors (Oil-Soluble Inhibitors, Water-Soluble Inhibitors and Water-Soluble Inhibitors), By Area of Application (Offshore, and Onshore), By End-User (Cosmetics, Food & Beverage, Oil & Gas, Personal Care, and Water Treatment), and Segment Forecasts, 2026-2035.

Paraffin inhibitors are chemical additives used in the oil and gas industry to prevent or reduce the deposition of paraffin wax in pipelines and equipment, ensuring smooth flow, operational efficiency, and reduced maintenance costs. The paraffin inhibitors market is experiencing substantial growth, primarily driven by the rising requirement for oil and gas pipelines. Paraffin residue in pipelines can cause blockages, decrease flow efficiency, and increase operational costs, making inhibitors essential for smooth hydrocarbon transportation.
The increasing global energy demand and expansion of crude oil production have intensified pipeline usage, further boosting the requirement for effective paraffin management solutions. Additionally, the adoption of cutting-edge chemical formulations that prevent wax crystallization, along with stricter operational security standards in the oil and gas sector, is propelling market growth. Continuous investment in pipeline infrastructure in emerging regions also supports sustained demand for paraffin inhibitors.
The paraffin inhibitors market is experiencing robust growth, primarily driven by the increasing need for underwater pipelines in global energy infrastructure. Paraffin deposition in oil pipelines can cause blockages, decrease flow efficiency, and increase maintenance costs, posing significant operational challenges, particularly in deepwater and subsea oil extraction. As the global energy sector extends and offshore exploration intensifies, there is an increasing need for reliable solutions to prevent wax buildup. Paraffin inhibitors allow smooth crude oil transport, enhance pipeline longevity, and reduce operational downtime. Moreover, stringent regulations on pipeline safety and efficiency, coupled with rising investments in oil and gas infrastructure worldwide, are further strengthening market demand.
Some of the Key Players in the Paraffin Inhibitors Market:
· 3M
· Advantek
· Baker Hughes
· BASF
· Clariant
· Croda
· Desco
· Dorf Ketal Chemicals
· Dow
· Halliburton
· Mondi
· Nordic
· Nouryon
· Schlumberger
· Sonoco
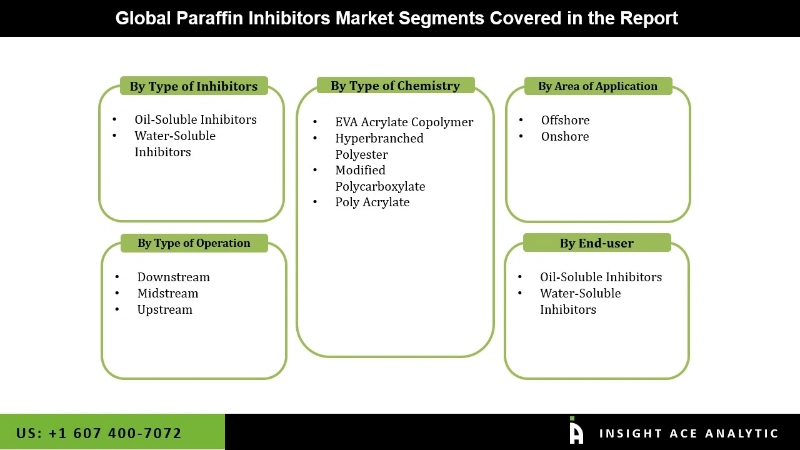
The paraffin inhibitors market is segmented by type of chemistry, by type of operation, by type of inhibitors, by area of application, by end-user, and by region. By type of chemistry, the market is segmented into EVA acrylate copolymer, hyperbranched polyester, modified polycarboxylate, and poly acrylate. By type of operation, the market is segmented into downstream, midstream, and upstream. By type of inhibitors, the market is segmented into oil-soluble inhibitors, and water-soluble inhibitors. By area of application, the market is segmented into offshore, and onshore. By end-user, the market is segmented into cosmetics, food & beverage, oil & gas, personal care, and water treatment.
The modified polycarboxylate is estimated to have a considerable market share by 2024 due to the growing requirement to minimize wax deposition in crude oil pipelines, which can cause clogs and reduced flow efficiency. Modified polycarboxylates operate as effective pour point depressants, increasing oil flow at low temperatures. Rising oil and gas production in cold climates, along with tightening requirements on operating efficiency and maintenance costs, is pushing demand for this technology. Furthermore, advances in inhibitor formulations and increased application in upstream and midstream activities drive market expansion.
Oil-soluble inhibitors dominate the paraffin inhibitors market due to the growing requirement to prevent wax deposition in pipelines, which can disrupt crude oil flow and decrease operational efficiency. Oil-soluble inhibitors are preferred for their compatibility with hydrocarbon systems and effectiveness in high-temperature reservoirs. Major drivers include the increasing global oil and gas production, the push for uninterrupted flow in ageing and deepwater wells, and stringent operational standards that require reliable flow assurance solutions to decrease maintenance expenses and production losses.
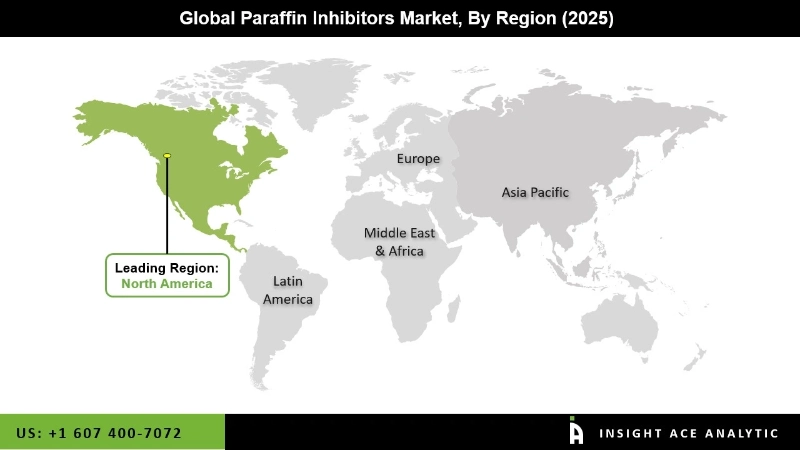
North America dominates the market for paraffin inhibitors due to the growing oil and gas production in shale and conventional reservoirs within region, where paraffin deposition can clog pipelines and reduce flow efficiency. Regional growth is also contributed to the increasing need to maintain uninterrupted oil flow and minimise operational downtime, which is driving the adoption of chemical inhibitors. Additionally, stringent regulations on production efficiency and cost optimization, combined with technological advancements in inhibitor formulations, are further expected to push market growth in the region.
Furthermore, Europe's paraffin inhibitors industry is being driven by the region's increased oil and gas production, where paraffin deposition in pipelines reduces flow efficiency and raises maintenance costs. The necessity to maintain uninterrupted production in aged areas, as well as the increased need for better oil recovery techniques, are key factors. The use of improved chemical inhibitors to prevent wax deposition, combined with tight rules governing operating safety and efficiency, is driving market expansion.

Paraffin Inhibitors Market by Type of Chemistry-
· EVA Acrylate Copolymer
· Hyperbranched Polyester
· Modified Polycarboxylate
· Poly Acrylate

Paraffin Inhibitors Market by Type of Operation-
· Downstream
· Midstream
· Upstream
Paraffin Inhibitors Market by Type of Inhibitors-
· Oil-Soluble Inhibitors
· Water-Soluble Inhibitors
Paraffin Inhibitors Market by Area of Application-
· Offshore
· Onshore
Paraffin Inhibitors Market by End-User-
· Oil-Soluble Inhibitors
· Water-Soluble Inhibitors
Paraffin Inhibitors Market by Region-
North America-
· The US
· Canada
Europe-
· Germany
· The UK
· France
· Italy
· Spain
· Rest of Europe
Asia-Pacific-
· China
· Japan
· India
· South Korea
· Southeast Asia
· Rest of Asia Pacific
Latin America-
· Brazil
· Argentina
· Mexico
· Rest of Latin America
Middle East & Africa-
· GCC Countries
· South Africa
· Rest of the Middle East and Africa
This study employed a multi-step, mixed-method research approach that integrates:
This approach ensures a balanced and validated understanding of both macro- and micro-level market factors influencing the market.
Secondary research for this study involved the collection, review, and analysis of publicly available and paid data sources to build the initial fact base, understand historical market behaviour, identify data gaps, and refine the hypotheses for primary research.
Secondary data for the market study was gathered from multiple credible sources, including:
These sources were used to compile historical data, market volumes/prices, industry trends, technological developments, and competitive insights.

Primary research was conducted to validate secondary data, understand real-time market dynamics, capture price points and adoption trends, and verify the assumptions used in the market modelling.
Primary interviews for this study involved:
Interviews were conducted via:
Primary insights were incorporated into demand modelling, pricing analysis, technology evaluation, and market share estimation.
All collected data were processed and normalized to ensure consistency and comparability across regions and time frames.
The data validation process included:
This ensured that the dataset used for modelling was clean, robust, and reliable.
The bottom-up approach involved aggregating segment-level data, such as:
This method was primarily used when detailed micro-level market data were available.

The top-down approach used macro-level indicators:
This approach was used for segments where granular data were limited or inconsistent.
To ensure accuracy, a triangulated hybrid model was used. This included:
This multi-angle validation yielded the final market size.
Market forecasts were developed using a combination of time-series modelling, adoption curve analysis, and driver-based forecasting tools.
Given inherent uncertainties, three scenarios were constructed:
Sensitivity testing was conducted on key variables, including pricing, demand elasticity, and regional adoption.