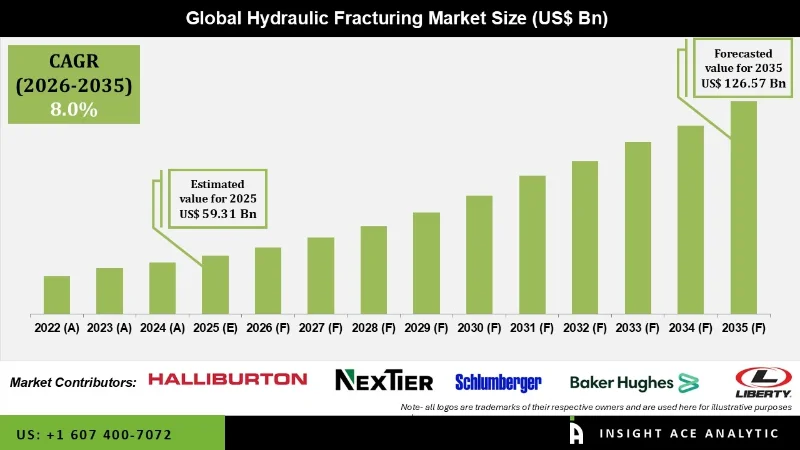
Hydraulic Fracturing Market Size is valued at USD 59.31 Bn in 2025 and is predicted to reach USD 126.57 Bn by the year 2035 at a 8.0% CAGR during the forecast period for 2026 to 2035.
Hydraulic Fracturing Market Size, Share & Trends Analysis Report By Technology (Plug & Perf, Sliding Sleeve), By Well Type (Horizontal Well, Vertical Well), By Application (Shale Gas, Tight Oil, Tight Gas), By Region, And By Segment Forecasts, 2026 to 2035

Hydraulic fracturing is a well-stimulation technique that fractures bedrock rocks with a pressurised liquid to facilitate the extraction of oil and gas reserves. The expanding demand for oil, gas, and other petroleum products from developing economies and increased attempts to cut the cost of oil and gas production will drive market expansion.
The rising global need for energy, notably oil and natural gas, drives the hydraulic fracturing business. As conventional reserves dwindle, there is a greater reliance on unconventional resources, such as shale gas and tight oil, which need hydraulic fracturing to extract. The market is being pushed by the requirement to meet the increasing energy demands of various industries.
However, the pandemic cut worldwide oil and gas demand significantly due to lockdowns, travel restrictions, and economic slowdowns. This reduced drilling and production activity, affecting demand for hydraulic fracturing services.
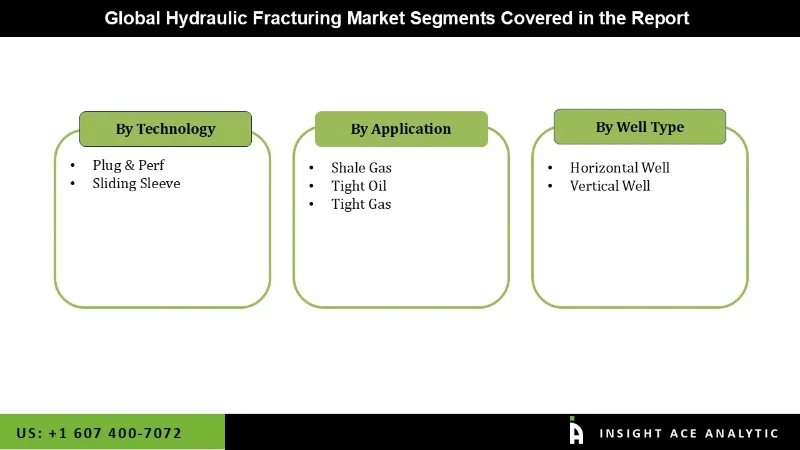
The Segmentation of Hydraulic Fracturing Market is on the basis of Technology, Application, and Well Type. on the basis of technology, the market is segmented as plug & perf and sliding sleeve. The application segment includes shale gas, tight oil, and tight gas. The market is segmented by well type into horizontal and vertical wells.
The plug & perf category is expected to hold a major share of the global Hydraulic Fracturing Market in 2022. The plug and perf technology applies to both vertical and horizontal wells. It is the most popular and widely utilized fracturing technology for unconventional wells. The plug & perf category is expected to increase significantly because it is the most widely utilized technology due to its easiness of operation and low cost. It improves production performance while also lowering production costs.
The shale gas segment is projected to grow at a rapid rate in the global Hydraulic Fracturing Market. There are several shale reserves all over the world. According to the EIA, there are 48 shale gas basins in 32 nations, each with almost 70 shale gas deposits. China, for example, has 21.8 TCM of technically viable shale gas reserves and 764.3 BCM of proven shale gas reserves, both located primarily in marine facies in the Sichuan basin. Similarly, Argentina has 802 billion cubic feet of theoretically recoverable shale gas deposits, while Algeria has the world’s third-largest undiscovered shale gas resources, with 20 trillion cubic meters of technically recoverable shale gas. Such enormous reserves are driving the hydraulic fracturing market.
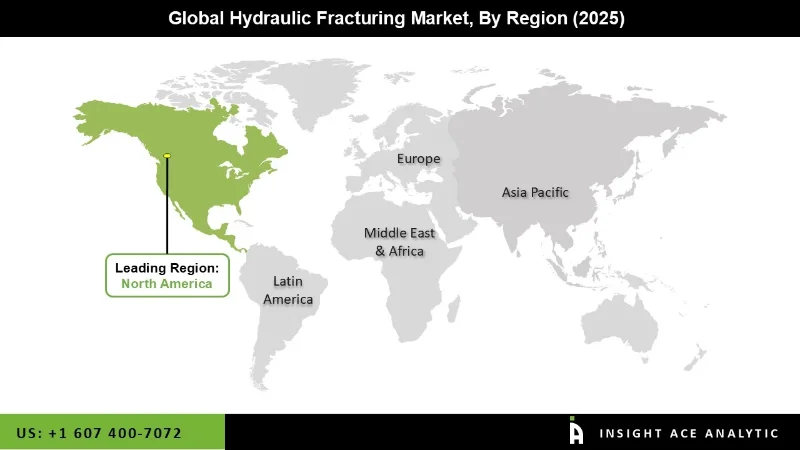
The North America Hydraulic Fracturing Market is expected to register the maximum market share in terms of revenue in the near future. The US is a significant and leading country with enormous potential for shale gas, tight gas reserves, and oil and natural gas production. Industry standards, effective state regulations, best practices, and supportive federal legislation are protecting communities and the environment.

Furthermore, these laws will increase natural gas output, allowing the United States to maintain its market share advantage. As a result, forthcoming breakthroughs and ongoing investments in unconventional gas production are boosting market expansion in the US. Oil and gas companies in China launched initiatives to liberate natural gas from shale rock formations, which led to the use of fracturing for reserve exploration. The government has pledged to increase local output and international participation in the exploration and production (E&P) business, indicating an increase in production and investments.
| Report Attribute | Specifications |
| Market Size Value In 2025 | USD 59.31 Billion |
| Revenue Forecast In 2035 | USD 126.57 Billion |
| Growth Rate CAGR | CAGR of 8.0% from 2026 to 2035 |
| Quantitative Units | Representation of revenue in US$ Bn and CAGR from 2026 to 2035 |
| Historic Year | 2022 to 2024 |
| Forecast Year | 2026 to 2035 |
| Report Coverage | The forecast of revenue, the position of the company, the competitive market structure, growth prospects, and trends |
| Segments Covered | By Technology, By Well Type, By Application |
| Regional Scope | North America; Europe; Asia Pacific; Latin America; Middle East & Africa |
| Country Scope | U.S.; Canada; U.K.; Germany; China; India; Japan; Brazil; Mexico ;The UK; France; Italy; Spain; China; Japan; India; South Korea; South East Asia; South Korea; South East Asia |
| Competitive Landscape | Halliburton (US), Schlumberger (US), Liberty Oilfield Services LLC (US), Baker Hughes (US), NexTier Oilfield Solutions (US), Calfrac Well Services Ltd. (Canada), STEP Energy Services (Canada), Patterson-UTI Energy, Inc. (US), Trican (Canada), National Energy Services Reunited Corp. (US), Petro Welt Technologies AG (Austria), ProFrac Holding Corp. (US), Tacrom (Romania) TAM International, Inc. (US), GD Energy Products, LLC (US), Petro Welt Technologies AG (Austria), ProPetro Holding Corp. (US), TechnipFMC plc (UK), Weatherford (US), Nine Energy Service (US), and AFG Holdings, Inc (US). |
| Customization Scope | Free customization report with the procurement of the report, Modifications to the regional and segment scope. Particular Geographic competitive landscape. |
| Pricing And Available Payment Methods | Explore pricing alternatives that are customized to your particular study requirements. |
Hydraulic Fracturing Market By Technology-

Hydraulic Fracturing Market By Well Type-
Hydraulic Fracturing Market By Application-
Hydraulic Fracturing Market By Region-
North America-
Europe-
Asia-Pacific-
Latin America-
Middle East & Africa-
This study employed a multi-step, mixed-method research approach that integrates:
This approach ensures a balanced and validated understanding of both macro- and micro-level market factors influencing the market.
Secondary research for this study involved the collection, review, and analysis of publicly available and paid data sources to build the initial fact base, understand historical market behaviour, identify data gaps, and refine the hypotheses for primary research.
Secondary data for the market study was gathered from multiple credible sources, including:
These sources were used to compile historical data, market volumes/prices, industry trends, technological developments, and competitive insights.

Primary research was conducted to validate secondary data, understand real-time market dynamics, capture price points and adoption trends, and verify the assumptions used in the market modelling.
Primary interviews for this study involved:
Interviews were conducted via:
Primary insights were incorporated into demand modelling, pricing analysis, technology evaluation, and market share estimation.
All collected data were processed and normalized to ensure consistency and comparability across regions and time frames.
The data validation process included:
This ensured that the dataset used for modelling was clean, robust, and reliable.
The bottom-up approach involved aggregating segment-level data, such as:
This method was primarily used when detailed micro-level market data were available.

The top-down approach used macro-level indicators:
This approach was used for segments where granular data were limited or inconsistent.
To ensure accuracy, a triangulated hybrid model was used. This included:
This multi-angle validation yielded the final market size.
Market forecasts were developed using a combination of time-series modelling, adoption curve analysis, and driver-based forecasting tools.
Given inherent uncertainties, three scenarios were constructed:
Sensitivity testing was conducted on key variables, including pricing, demand elasticity, and regional adoption.