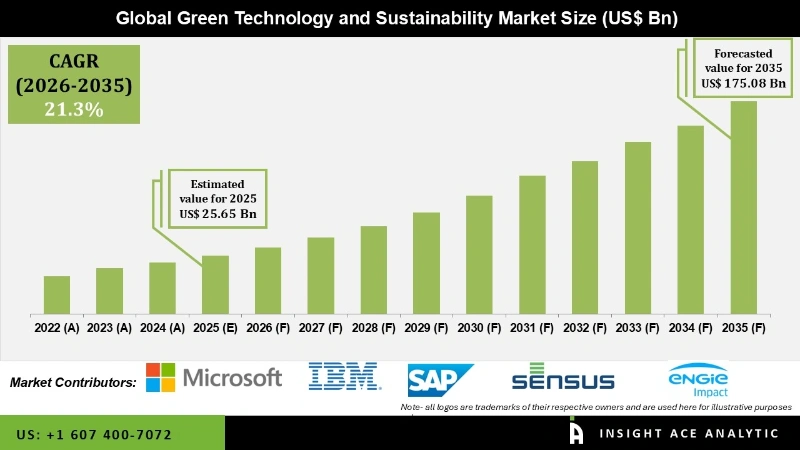
The Green Technology and Sustainability Market Size is valued at USD 25.65 Bn in 2025 and is predicted to reach USD 175.08 Bn by the year 2035 at an 21.3% CAGR during the forecast period for 2026 to 2035.
Green Technology and Sustainability Market, Share & Trends Analysis Report By Component (Solutions & Services), By Deployment (Cloud & On-Premise), By Enterprise Type (Large Enterprise and SMEs), By Implemented Technology (Internet of Things, AI & Analytics, Digital Twin, Cloud Computing, Blockchain), By Application, By Region, and Segment Forecasts, 2026 to 2035.

Green technology, commonly referred to as "environmental technology" or "cleantech," is a collection of methods, materials, and innovations designed to minimize or eliminate negative impacts on the environment, promote energy efficiency, and ensure the sustainability of natural resources. This field includes inventions that address pressing environmental issues such as waste, pollution, carbon emissions, and resource depletion. It also encompasses energy-efficient technologies that reduce the amount of energy required to provide goods and services, such as efficient appliances, lighting, and buildings. Sustainable agricultural practices are a core part of green technology, as they focus on maintaining soil fertility, reducing pesticide usage, conserving water, and promoting biodiversity through methods like organic farming and precision agriculture. Additionally, green technology emphasizes innovations in recycling and waste management, concentrating on reusing materials, reducing waste generation, and converting waste into energy or valuable raw materials.
Artificial intelligence is revolutionizing recycling processes by enhancing sorting accuracy, optimizing material recovery, and reducing waste. In response to growing environmental concerns, governments worldwide are implementing stricter regulations to reduce greenhouse gas emissions and promote sustainable practices. The market for sustainability and green technology is expanding rapidly, driven by increased awareness of climate change and the desire to minimize environmental impact. Both businesses and consumers are seeking eco-friendly solutions as concerns about resource depletion and environmental degradation intensify. To foster sustainable practices and technologies across various sectors, governments are enacting stringent laws and offering incentives.
Demand for green technologies is on the rise, from energy-efficient appliances and eco-friendly transportation to renewable energy sources like solar and wind power. Environmental regulations primarily drive the sustainability market, encouraging companies to adopt eco-friendly practices. Businesses are also investing in green technologies to comply with strict standards for emissions, waste management, and renewable energy, while government incentives provide additional motivation. Meanwhile, growing consumer demand for environmentally conscious products further fuels industry growth, paving the way for a more sustainable future.
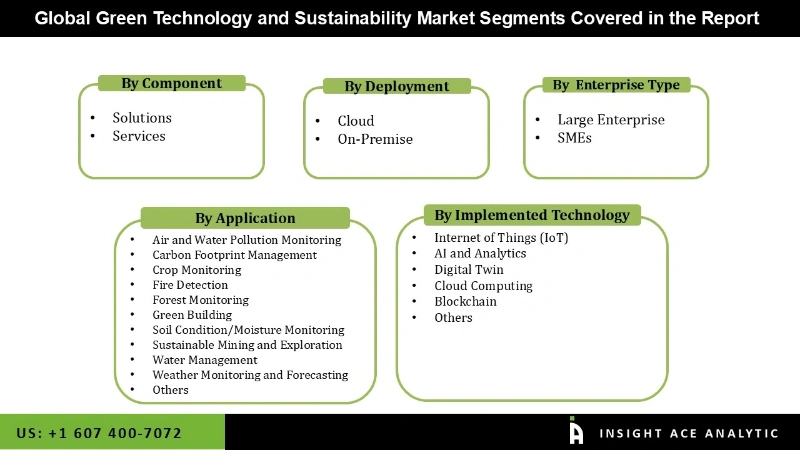
The green technology and sustainability Market is segmented based on component, and deployment, enterprise type, implemented technology, and application. Based on the components, the Market is divided into solutions & services. Based on the deployment, the Market is divided into cloud & on-premise. Based on the implemented technology, the Market is divided into the Internet of Things, AI & analytics, digital twin, cloud computing, and blockchain. Based on the application, the market is divided into air & water pollution monitoring, carbon footprint management, crop monitoring, fire detection, forest monitoring, green building, soil condition monitoring, sustainable mining, water management, and weather monitoring.
Based on the components, the Market is divided into solutions & services. Among these, the solutions segment is expected to have the highest growth rate during the forecast period. Innovations in energy-efficient products and technologies are essential for reducing energy consumption across various industries and households, driving the solutions market. As countries strive to reduce carbon emissions, there is a significant increase in the adoption of renewable energy technologies like solar and wind power. This demand fuels the growth of the solutions segment. Many governments provide subsidies, tax incentives, and grants for the adoption of green technologies, encouraging businesses and consumers to invest in sustainable solutions. Growing environmental awareness among consumers drives the demand for green products and services, further expanding the solutions market. Continuous advancements and decreasing costs of green technologies make them more accessible and attractive, enhancing the solutions segment's growth.
Based on the implemented technology, the Market is divided into the Internet of Things, AI & analytics, digital twin, cloud computing, and blockchain. Among these, the ai and analytics segment dominates the market. AI and Analytics provide real-time insights that help organizations make informed decisions to optimize operations for sustainability. By analyzing data from IoT sensors, energy systems, and production processes, AI-driven insights identify areas to reduce waste, minimize energy use, and lower emissions. This data-driven approach enables precise adjustments that significantly impact sustainability. The AI and Analytics sector is rapidly evolving, leading to frequent innovations and reduced costs for implementation. As these technologies become more accessible, more companies can adopt them to drive sustainability initiatives. The continuous improvement in AI algorithms also enhances the efficiency and accuracy of green technologies, fueling even greater adoption across sectors.
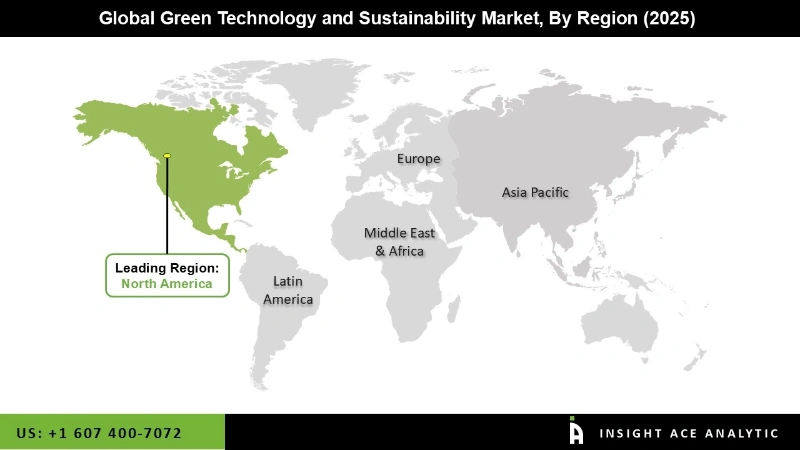
North America is a global leader in research and development, with significant investments in developing advanced green technologies. Government programs, private investments, and research grants fuel innovations in renewable energy, AI-driven sustainability solutions, and climate resilience technologies. The region’s technology hubs, such as Silicon Valley, attract venture capital and foster innovation in green technology startups, contributing to rapid growth in the sustainability sector. Many North American companies have made strong commitments to sustainability, setting ambitious goals to reduce their carbon footprint, manage waste responsibly, and improve energy efficiency. This includes major corporations across technology, manufacturing, retail, and energy sectors.

| Report Attribute | Specifications |
| Market Size Value In 2025 | USD 25.65 Bn |
| Revenue Forecast In 2035 | USD 175.08 Bn |
| Growth Rate CAGR | CAGR of 21.3% from 2026 to 2035 |
| Quantitative Units | Representation of revenue in US$ Bn and CAGR from 2026 to 2035 |
| Historic Year | 2022 to 2024 |
| Forecast Year | 2026-2035 |
| Report Coverage | The forecast of revenue, the position of the company, the competitive Market structure, growth prospects, and trends |
| Segments Covered | Component, and Deployment, Enterprise Type, Implemented Technology, and Application. |
| Regional Scope | North America; Europe; Asia Pacific; Latin America; Middle East & Africa |
| Country Scope | U.S.; Canada; U.K.; Germany; China; India; Japan; Brazil; Mexico; France; Italy; Spain; South Korea; South East Asia |
| Competitive Landscape | Alphabet Inc., IBM Corporation, Sensus, Microsoft Corporation, ENGIE Impact, General Electric Company, Schneider Electric, Oracle Corporation, CropX Inc., Taranis Visual Ltd., Cority, Lo3 Energy, Salesforce, Inc., Xylem, Wolters Kluwer N.V., Enviance, Huawei, SAP, Siemens, SunPower Corporation, Wolters Kluwer N.V., Trace Genomics, Enablon, Taranis, Consensys, Hortau, SMAP Energy, Treevia |
| Customization Scope | Free customization report with the procurement of the report and modifications to the regional and segment scope. Particular Geographic competitive landscape. |
| Pricing and Available Payment Methods | Explore pricing alternatives that are customized to your particular study requirements. |
Global Green Technology and Sustainability Market- By Component

Global Green Technology and Sustainability Market- By Deployment
Global Green Technology and Sustainability Market – By Enterprise Type
Global Green Technology and Sustainability Market – By Implemented Technology
Global Green Technology and Sustainability Market – By Application
Global Green Technology and Sustainability Market – By Region
North America-
Europe-
Asia-Pacific-
Latin America-
Middle East & Africa-
This study employed a multi-step, mixed-method research approach that integrates:
This approach ensures a balanced and validated understanding of both macro- and micro-level market factors influencing the market.
Secondary research for this study involved the collection, review, and analysis of publicly available and paid data sources to build the initial fact base, understand historical market behaviour, identify data gaps, and refine the hypotheses for primary research.
Secondary data for the market study was gathered from multiple credible sources, including:
These sources were used to compile historical data, market volumes/prices, industry trends, technological developments, and competitive insights.

Primary research was conducted to validate secondary data, understand real-time market dynamics, capture price points and adoption trends, and verify the assumptions used in the market modelling.
Primary interviews for this study involved:
Interviews were conducted via:
Primary insights were incorporated into demand modelling, pricing analysis, technology evaluation, and market share estimation.
All collected data were processed and normalized to ensure consistency and comparability across regions and time frames.
The data validation process included:
This ensured that the dataset used for modelling was clean, robust, and reliable.
The bottom-up approach involved aggregating segment-level data, such as:
This method was primarily used when detailed micro-level market data were available.

The top-down approach used macro-level indicators:
This approach was used for segments where granular data were limited or inconsistent.
To ensure accuracy, a triangulated hybrid model was used. This included:
This multi-angle validation yielded the final market size.
Market forecasts were developed using a combination of time-series modelling, adoption curve analysis, and driver-based forecasting tools.
Given inherent uncertainties, three scenarios were constructed:
Sensitivity testing was conducted on key variables, including pricing, demand elasticity, and regional adoption.