Green Ammonia Market Size is valued at 0.7 Billion in 2024 and is predicted to reach 140.2 billion by the year 2034 at a 70.0% CAGR during the forecast period for 2025-2034.

In the upcoming years, the market demand is anticipated to increase as green ammonia becomes more commonplace due to growing awareness of the importance of creating clean energy and lowering carbon footprints. It is also projected that market expansion will be fueled shortly by the rising demand for the product as a marine fuel and shipping in the transportation sector because it emits no carbon and leaves no sulfur traces, leading to enhanced air quality. Nitrogen from the air and hydrogen from water combine to form green ammonia. It is a versatile fuel for heat and electricity that may be used in gas turbines, internal combustion engines, generator sets, industrial furnaces, and fuel cells. It is notably useful for naval transportation.
Green ammonia is the ideal choice due to the pressure on the shipping industry to decrease carbon emissions because it has a lower volumetric energy density than other fuels, which makes storage viable. The market is also expanding due to favorable laws and regulations governing low-carbon emissions and rising fuel demand from the marine industry.
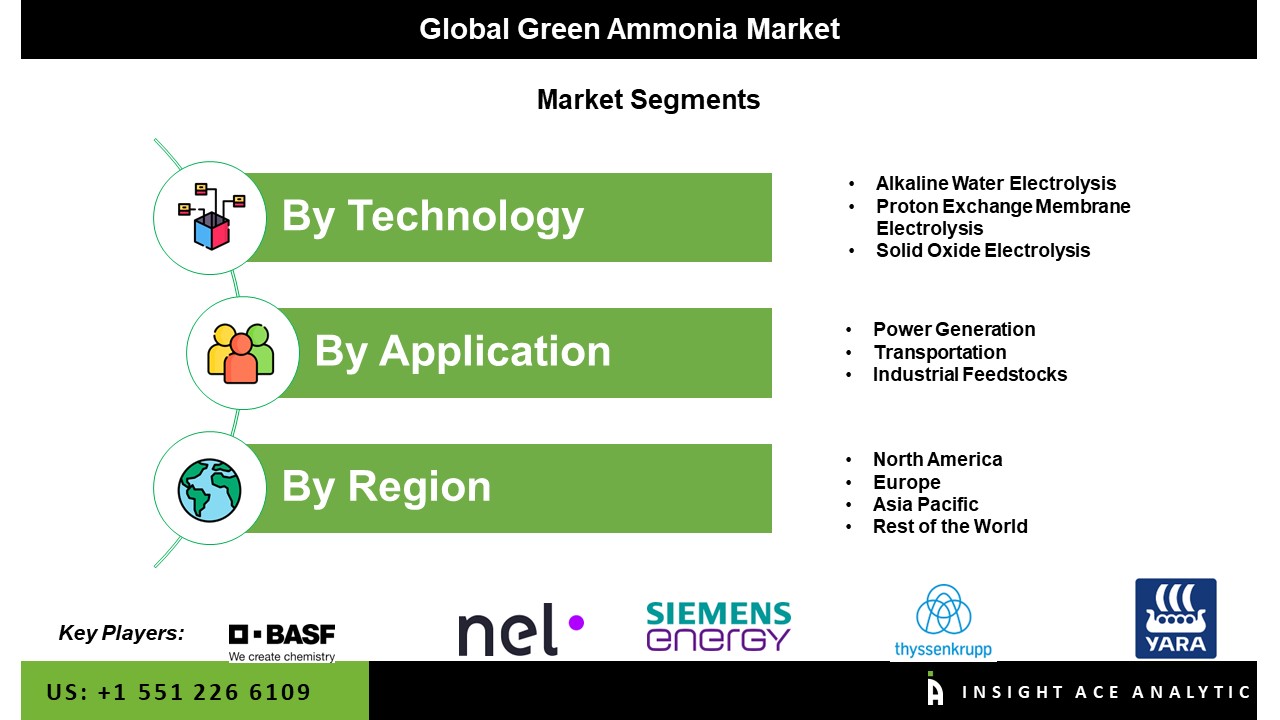
The Green Ammonia market is segmented by technology and end-use application. Based on technology, the market is segregated into alkaline water electrolysis, solid oxide electrolysis, and proton exchange membrane. By the end-use application, the market is segmented into transportation, power generation, and industrial feedback.
The market with the biggest revenue share was dominated by proton exchange membrane technology. The cause for this is that people are becoming more conscious of the benefits of this technology, which has an electric efficiency of above 90% and large current densities at low voltages. Favorable government incentives for the generation of green and clean energy as well as enhanced R&D on fuel cell technologies, can also boost product demand.
With the largest revenue share, the transportation sector dominated the market. The worldwide fuel energy crisis, which has fueled the need for green fuel, is to blame for its large share. Renewable sources, including green ammonia and others, are replacing conventional ones. These sources generate energy that is clean, effective, and environmentally benign.
The market with the largest revenue share was dominated by North America. The adoption of electric vehicles in the area and increased R&D for hydrogen production are credited with this surge. In addition, the market expansion is being fueled by government assistance, increasing investor involvement, and the viability of the technology in the area. The Asia Pacific market is predicted to grow. This is a result of government policies and programmes that aim to cut carbon emissions and promote renewable energy. For instance, the Indian government has offered subsidies to encourage the usage of electric cars there.
| Report Attribute | Specifications |
| Market size value in 2024 | USD 0.7 Bn |
| Revenue forecast in 2034 | USD 140.2 Bn |
| Growth rate CAGR | CAGR of 70.0% from 2025 to 2034 |
| Quantitative units | Representation of revenue in US$ Billion, Volume (Tons) and CAGR from 2025 to 2034 |
| Historic Year | 2021 to 2024 |
| Forecast Year | 2025-2034 |
| Report coverage | The forecast of revenue, the position of the company, the competitive market statistics, growth prospects, and trends |
| Segments covered | Technology And End-Use Application |
| Regional scope | North America; Europe; Asia Pacific; Latin America; Middle East & Africa |
| Country scope | U.S.; Canada; U.K.; Germany; Japan; Brazil; Mexico; The UK; France; Italy; Spain; Japan; India; South Korea; Southeast Asia |
| Competitive Landscape | Siemens Energy, NELASA, ThyssenKrupp AG, ITM Power, YARA International, and BASF SE. |
| Customization scope | Free customization report with the procurement of the report, Modifications to the regional and segment scope. Particular Geographic competitive landscape. |
| Pricing and available payment methods | Explore pricing alternatives that are customized to your particular study requirements. |
Green Ammonia Market By Technology-
Green Ammonia Market By End-Use Application-
Green Ammonia Market By Region-
North America-
Europe-
Asia-Pacific-
Latin America-
Middle East & Africa-
This study employed a multi-step, mixed-method research approach that integrates:
This approach ensures a balanced and validated understanding of both macro- and micro-level market factors influencing the market.
Secondary research for this study involved the collection, review, and analysis of publicly available and paid data sources to build the initial fact base, understand historical market behaviour, identify data gaps, and refine the hypotheses for primary research.
Secondary data for the market study was gathered from multiple credible sources, including:
These sources were used to compile historical data, market volumes/prices, industry trends, technological developments, and competitive insights.

Primary research was conducted to validate secondary data, understand real-time market dynamics, capture price points and adoption trends, and verify the assumptions used in the market modelling.
Primary interviews for this study involved:
Interviews were conducted via:
Primary insights were incorporated into demand modelling, pricing analysis, technology evaluation, and market share estimation.
All collected data were processed and normalized to ensure consistency and comparability across regions and time frames.
The data validation process included:
This ensured that the dataset used for modelling was clean, robust, and reliable.
The bottom-up approach involved aggregating segment-level data, such as:
This method was primarily used when detailed micro-level market data were available.

The top-down approach used macro-level indicators:
This approach was used for segments where granular data were limited or inconsistent.
To ensure accuracy, a triangulated hybrid model was used. This included:
This multi-angle validation yielded the final market size.
Market forecasts were developed using a combination of time-series modelling, adoption curve analysis, and driver-based forecasting tools.
Given inherent uncertainties, three scenarios were constructed:
Sensitivity testing was conducted on key variables, including pricing, demand elasticity, and regional adoption.