Biodiversity Conservation In Mining Market Size, Trend, Revenue Report 2026 to 2035
What is Biodiversity Conservation In Mining Market Size?
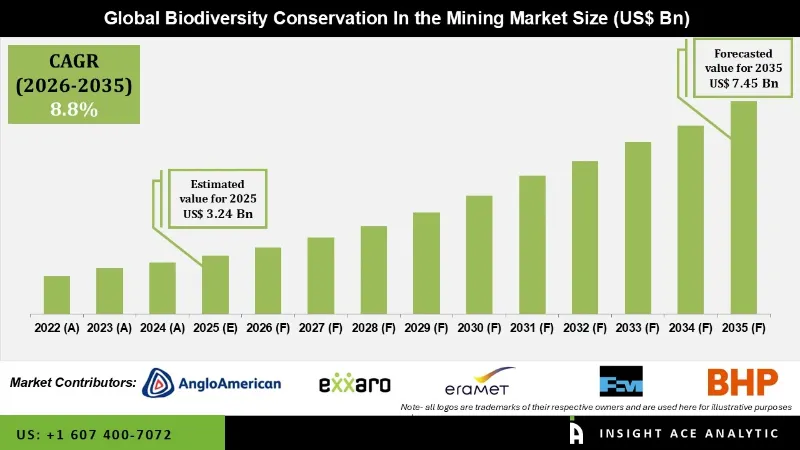
Biodiversity Conservation In Mining Market is valued at US$ 3.24 Bn in 2025 and it is expected to reach US$ 7.45 Bn by 2035, with a CAGR of 8.8% during the forecast period of 2026 to 2035.
Biodiversity Conservation In Mining Market Size, Share & Trends Analysis Distribution by Component (Rehabilitation & Ecological Restoration, Mitigation & Biodiversity Offsets, Consulting, Permitting & Biodiversity Action Planning, Monitoring, Surveillance & Verification, and Others), and Segment Forecasts, 2026 to 2035
Biodiversity Conservation In Mining Market Key Takeaways:
|
Biodiversity conservation in mining comprises the systematic approaches and measures used to protect, restore, and sustainably manage ecosystems and species in mining-affected areas. This involves minimizing ecological disruption through careful site planning, environmental impact assessments, and low-impact extraction methods. During operations, companies implement measures such as soil and water management, wildlife protection programs, and continuous ecological monitoring. Post-mining rehabilitation focuses on restoring native habitats, replanting indigenous vegetation, and supporting long-term ecosystem recovery.
The expansion of biodiversity conservation in mining is driven by regulatory requirements, corporate responsibility initiatives, and stakeholder expectations. Governments & international bodies are implementing stricter environmental regulations that mandate conservation outcomes, while growing ESG investment criteria create strong incentives for demonstrated ecological stewardship. These factors are generating increased demand for specialized conservation services, including ecological consulting, digital monitoring solutions, and habitat restoration expertise. Technological advancements in remote sensing, GIS mapping, and data analytics further support this growth by enabling more precise impact assessment and effective long-term ecosystem management.
Competitive Landscape
Some of the Key Players in Biodiversity Conservation In the Mining Market:
- Hindustan Zinc Ltd.
- Imerys
- Anglo American plc
- BHP Group
- Freeport-McMoRan
- Glencore plc
- Rio Tinto Group
- Eramet Group
- Exxaro Resources Limited
- Vale S.A.
Market Segmentation:
The biodiversity conservation in mining market is segmented by component. By component, the market is segmented into rehabilitation & ecological restoration, mitigation & biodiversity offsets, consulting, permitting & biodiversity action planning, monitoring, surveillance & verification, and others.
By Component, the Autonomous/Remotely Operated Segment is Expected to Drive the Biodiversity Conservation In Mining Market
In 2024, the mitigation & biodiversity offsets category dominated the biodiversity conservation in the mining market. The continuously increasing implementation of environmental regulations and the worldwide transition to sustainable mining techniques are driving the segment's growth. In order to balance ecological losses, offset programs have become widely used as a result of governments and financial institutions requiring mining operations to show quantifiable biodiversity impacts. Additionally, "no-net-loss" or "net-positive" biodiversity goals are emphasized by regulatory laws in places like australia, canada, and south africa, which encourage miners to repair damaged ecosystems or save comparable areas elsewhere.
Regionally, the Asia Pacific Led the Biodiversity Conservation In the Mining Market
In 2024, the asia pacific region maintained its dominant position in the biodiversity conservation market for mining, driven by expanding mining operations across developing economies and heightened recognition of ecological impacts in environmentally sensitive zones. Governments across australia, india, and southeast asian nations are implementing stricter environmental impact assessment requirements and mandating comprehensive rehabilitation obligations, compelling mining companies to adopt systematic conservation approaches.

The region's significant biological diversity and extensive protected areas further amplify the importance of responsible mining practices, stimulating demand for habitat restoration initiatives, biodiversity offset programs, and community-led conservation projects.
Europe is estimated to report the highest growth rate in biodiversity conservation in the mining market during the forecast period. This accelerated expansion is fueled by the European Union's rigorous environmental regulatory framework, which enforces stringent standards for ecological impact assessment, habitat restoration, and long-term ecosystem management. The region's growth is further supported by strong advocacy from environmental organizations and indigenous communities, alongside the rapid integration of advanced conservation technologies. These include automated biodiversity monitoring systems, GIS-based habitat mapping, and remote sensing applications, which are becoming standard tools for demonstrating compliance and achieving conservation excellence in mining operations.
Biodiversity Conservation In Mining Market Report Scope
| Report Attribute | Specifications |
| Market Size Value In 2025 | USD 3.24 Bn |
| Revenue Forecast In 2035 | USD 7.45 Bn |
| Growth Rate CAGR | CAGR of 8.8% from 2026 to 2035 |
| Quantitative Units | Representation of revenue in US$ Bn and CAGR from 2026 to 2035 |
| Historic Year | 2022 to 2024 |
| Forecast Year | 2026 to 2035 |
| Report Coverage | The forecast of revenue, the position of the company, the competitive market structure, growth prospects, and trends |
| Segments Covered | By Component and By Region |
| Regional Scope | North America; Europe; Asia Pacific; Latin America; Middle East & Africa |
| Country Scope | U.S.; Canada; Germany; The UK; France; Italy; Spain; Rest of Europe; China; Japan; India; South Korea; Southeast Asia; Rest of Asia Pacific; Brazil; Argentina; Mexico; Rest of Latin America; GCC Countries; South Africa; Rest of the Middle East and Africa |
| Competitive Landscape | Hindustan Zinc Ltd., Imerys, Anglo American plc, BHP Group, Freeport-McMoRan, Glencore plc, Rio Tinto Group, Eramet Group, Exxaro Resources Limited, and Vale S.A. |
| Customization Scope | Free customization report with the procurement of the report, Modifications to the regional and segment scope. Geographic competitive landscape. |
| Pricing and Available Payment Methods | Explore pricing alternatives that are customized to your particular study requirements. |
Segmentation of Biodiversity Conservation In Mining Market -
Biodiversity Conservation In Mining Market by Component-
· Rehabilitation & Ecological Restoration
· Mitigation & Biodiversity Offsets
· Consulting, Permitting & Biodiversity Action Planning
· Monitoring, Surveillance & Verification
· Others

Biodiversity Conservation In Mining Market by Region-
North America-
· The US
· Canada
Europe-
· Germany
· The UK
· France
· Italy
· Spain
· Rest of Europe
Asia-Pacific-
· China
· Japan
· India
· South Korea
· Southeast Asia
· Rest of Asia Pacific
Latin America-
· Brazil
· Argentina
· Mexico
· Rest of Latin America
Middle East & Africa-
· GCC Countries
· South Africa
· Rest of the Middle East and Africa
Research Design and Approach
This study employed a multi-step, mixed-method research approach that integrates:
- Secondary research
- Primary research
- Data triangulation
- Hybrid top-down and bottom-up modelling
- Forecasting and scenario analysis
This approach ensures a balanced and validated understanding of both macro- and micro-level market factors influencing the market.
Secondary Research
Secondary research for this study involved the collection, review, and analysis of publicly available and paid data sources to build the initial fact base, understand historical market behaviour, identify data gaps, and refine the hypotheses for primary research.
Sources Consulted
Secondary data for the market study was gathered from multiple credible sources, including:
- Government databases, regulatory bodies, and public institutions
- International organizations (WHO, OECD, IMF, World Bank, etc.)
- Commercial and paid databases
- Industry associations, trade publications, and technical journals
- Company annual reports, investor presentations, press releases, and SEC filings
- Academic research papers, patents, and scientific literature
- Previous market research publications and syndicated reports
These sources were used to compile historical data, market volumes/prices, industry trends, technological developments, and competitive insights.

Primary Research
Primary research was conducted to validate secondary data, understand real-time market dynamics, capture price points and adoption trends, and verify the assumptions used in the market modelling.
Stakeholders Interviewed
Primary interviews for this study involved:
- Manufacturers and suppliers in the market value chain
- Distributors, channel partners, and integrators
- End-users / customers (e.g., hospitals, labs, enterprises, consumers, etc., depending on the market)
- Industry experts, technology specialists, consultants, and regulatory professionals
- Senior executives (CEOs, CTOs, VPs, Directors) and product managers
Interview Process
Interviews were conducted via:
- Structured and semi-structured questionnaires
- Telephonic and video interactions
- Email correspondences
- Expert consultation sessions
Primary insights were incorporated into demand modelling, pricing analysis, technology evaluation, and market share estimation.
Data Processing, Normalization, and Validation
All collected data were processed and normalized to ensure consistency and comparability across regions and time frames.
The data validation process included:
- Standardization of units (currency conversions, volume units, inflation adjustments)
- Cross-verification of data points across multiple secondary sources
- Normalization of inconsistent datasets
- Identification and resolution of data gaps
- Outlier detection and removal through algorithmic and manual checks
- Plausibility and coherence checks across segments and geographies
This ensured that the dataset used for modelling was clean, robust, and reliable.
Market Size Estimation and Data Triangulation
Bottom-Up Approach
The bottom-up approach involved aggregating segment-level data, such as:
- Company revenues
- Product-level sales
- Installed base/usage volumes
- Adoption and penetration rates
- Pricing analysis
This method was primarily used when detailed micro-level market data were available.

Top-Down Approach
The top-down approach used macro-level indicators:
- Parent market benchmarks
- Global/regional industry trends
- Economic indicators (GDP, demographics, spending patterns)
- Penetration and usage ratios
This approach was used for segments where granular data were limited or inconsistent.
Hybrid Triangulation Approach
To ensure accuracy, a triangulated hybrid model was used. This included:
- Reconciling top-down and bottom-up estimates
- Cross-checking revenues, volumes, and pricing assumptions
- Incorporating expert insights to validate segment splits and adoption rates
This multi-angle validation yielded the final market size.
Forecasting Framework and Scenario Modelling
Market forecasts were developed using a combination of time-series modelling, adoption curve analysis, and driver-based forecasting tools.
Forecasting Methods
- Time-series modelling
- S-curve and diffusion models (for emerging technologies)
- Driver-based forecasting (GDP, disposable income, adoption rates, regulatory changes)
- Price elasticity models
- Market maturity and lifecycle-based projections
Scenario Analysis
Given inherent uncertainties, three scenarios were constructed:
- Base-Case Scenario: Expected trajectory under current conditions
- Optimistic Scenario: High adoption, favourable regulation, strong economic tailwinds
- Conservative Scenario: Slow adoption, regulatory delays, economic constraints
Sensitivity testing was conducted on key variables, including pricing, demand elasticity, and regional adoption.
Request Customization
Add countries, segments, company profiles, or extend forecast — free 10% customization with purchase.
Customize This Report →Enquire Before Buying
Speak with our analyst team about scope, methodology, pricing, or deliverable formats.
Enquire Now →Frequently Asked Questions
Biodiversity Conservation In Mining Market is valued at US$ 3.24 Bn in 2025 and it is expected to reach US$ 7.45 Bn by 2035, with a CAGR of 8.8% during the forecast period of 2026 to 2035.
The major players in the Biodiversity Conservation In Mining market are Hindustan Zinc Ltd., Imerys, Anglo American plc, BHP Group, Freeport-McMoRan, Glencore plc, Rio Tinto Group, Eramet Group, Exxaro Resources Limited, and Vale S.A.
The primary Biodiversity Conservation In Mining market segments are Component and Application.
Asia Pacific leads the market for Biodiversity Conservation In Mining due to development of mining operations throughout rising nations and growing awareness of the consequences of biodiversity loss in environmentally sensitive areas.