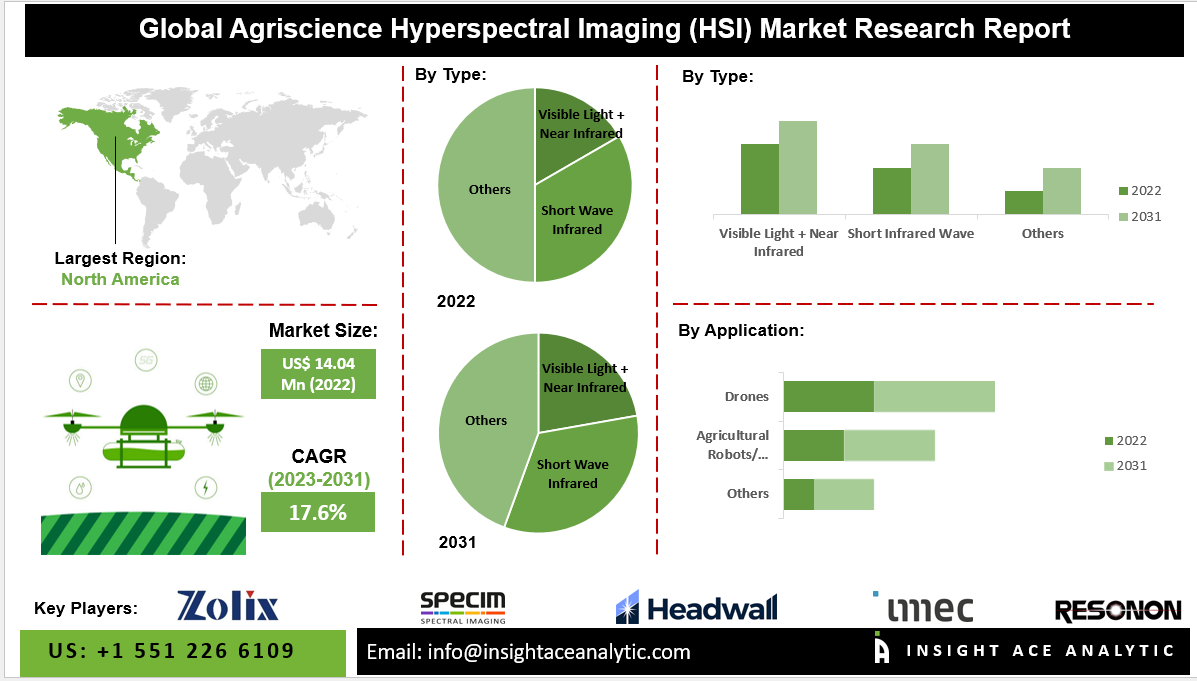
Agriscience Hyperspectral Imaging (HSI) Market Size is valued at USD 14.04 Mn in 2022 and is predicted to reach USD 59.43 Mn by the year 2031 at a 17.66% CAGR during the forecast period for 2023-2031.

Precision agriculture, which focuses on optimizing efficient farming practices, assumes a pivotal role given that Hyperspectral Imaging (HSI) offers detailed spectral information essential for accurate crop monitoring and management. Continuous technological advancements in HSI, such as improved sensor capabilities and enhanced data processing techniques, contribute to making this technology more accessible and appealing to farmers. Government support and initiatives promoting sustainable and intelligent farming often come with incentives for adopting advanced technologies like HSI. The growing demand for HSI is driven by the necessity for effective crop monitoring, disease detection, and resource optimization, empowering farmers to make informed decisions based on precise spectral data. Overcoming challenges related to costs and integration, as well as providing adequate training and support for farmers, becomes crucial in facilitating the broader adoption of HSI in the agriscience sector.
Moreover, collaborations and partnerships among technology providers, research institutions, and agricultural organizations foster innovation, resulting in tailored HSI solutions that address specific challenges in the agricultural sector. Collectively, these drivers underscore the significance of HSI in modern agriscience practices, providing advanced tools for sustainable and efficient farming.
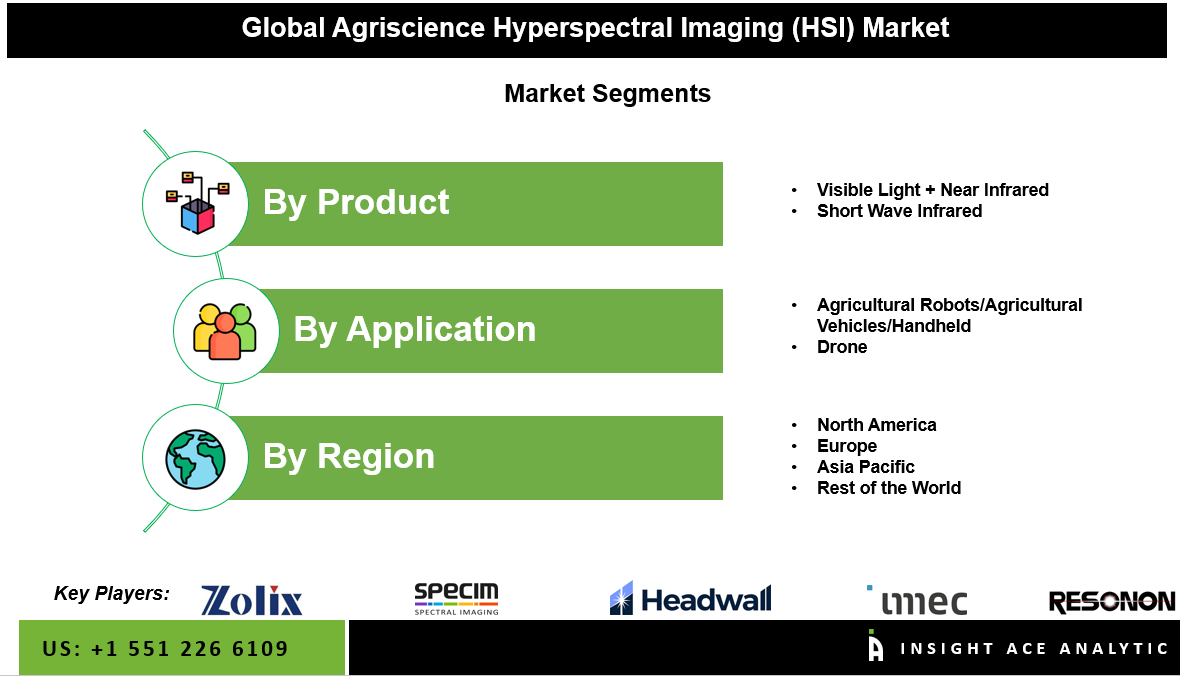
The agriscience hyperspectral imaging (HSI) market is bifurcated on the basis of type and application. Based on type, the market is segmented as visible light + near infrared and short infrared wave. By application, the Agriscience Hyperspectral Imaging (HSI) market is segmented into agricultural robots/ agricultural vehicles and drones.
The drone category is expected to hold a major share of the global agriscience hyperspectral imaging (HSI) market in 2022. Drones can be integrated with farm management software, allowing farmers to streamline data analysis and decision-making processes. This rising integration enhances the overall efficiency and effectiveness of agricultural operations. Drones are effective tools for environmental monitoring, helping farmers assess soil health, irrigation efficiency, and the overall environmental impact of farming practices.
The short waves infrared category is projected to develop at a speedy rate in the global agriscience hyperspectral imaging (HSI) market. "Short infrared" typically refers to the near-infrared (NIR) range in hyperspectral imaging. Near-infrared hyperspectral imaging plays a crucial role in agriscience applications due to its ability to capture detailed spectral information beyond what is visible to the human eye. This spectral range, commonly referred to as NIR, is particularly valuable in analyzing plant health, moisture content, and nutrient levels in crops. NIR hyperspectral imaging allows for the precise monitoring of plant health by capturing subtle variations in the NIR spectrum associated with chlorophyll content and photosynthetic activity.
The North American agriscience hyperspectral imaging (HSI) market is expected to register the highest market. The adoption of HSI in North America is closely tied to the broader trend of precision agriculture. Farmers in the region are increasingly recognizing the benefits of using advanced technologies like HSI for precise monitoring of crops, early disease detection, and efficient resource management. The market has seen growth driven by factors such as the increasing emphasis on precision agriculture, government support for sustainable farming practices, and the need for advanced technologies to enhance productivity. Furthermore, Europe is anticipated to experience substantial growth in the worldwide agriscience hyperspectral imaging (HSI) market. The continent has been a pioneer in the adoption of precision agriculture methods, with hyperspectral imaging playing a pivotal role in this context. The comprehensive data acquired through HSI supports farmers in making well-informed choices regarding crop management, allocating resources efficiently, and detecting diseases.
| Report Attribute | Specifications |
| Market Size Value In 2022 | USD 14.04 Mn |
| Revenue Forecast In 2031 | USD 59.43 Mn |
| Growth Rate CAGR | CAGR of 17.66% from 2023 to 2031 |
| Quantitative Units | Representation of revenue in US$ Million and CAGR from 2023 to 2031 |
| Historic Year | 2019 to 2022 |
| Forecast Year | 2023-2031 |
| Report Coverage | The forecast of revenue, the position of the company, the competitive market structure, growth prospects, and trends |
| Segments Covered | By Product, Application |
| Regional Scope | North America; Europe; Asia Pacific; Latin America; Middle East & Africa |
| Country Scope | U.S.; Canada; U.K.; Germany; China; India; Japan; Brazil; Mexico; France; Italy; Spain; South East Asia; South Korea |
| Competitive Landscape | Headwall Photonics, Inc.SPECIM, Spectral Imaging Ltd., IMEC, Corning Incorporate, Resonon Inc, Telops Inc, HyVista Corporation, Cubert GmbH, Surface Optics, Zolix, BaySpec, ITRES, Norsk Elektro Optikk A/S, Wayho Technology, TruTag (HinaLea Imaging), Brimrose, Spectra Vista and others. |
| Customization Scope | Free customization report with the procurement of the report and modifications to the regional and segment scope. Particular Geographic competitive landscape. |
| Pricing And Available Payment Methods | Explore pricing alternatives that are customized to your particular study requirements. |
Agriscience Hyperspectral Imaging (HSI) Market By Type-

Agriscience Hyperspectral Imaging (HSI) Market By Application-
Agriscience Hyperspectral Imaging (HSI) Market By Region-
North America-
Europe-
Asia-Pacific-
Latin America-
Middle East & Africa-
Chapter 1. Methodology and Scope
1.1. Research Methodology
1.2. Research Scope & Assumptions
Chapter 2. Executive Summary
Chapter 3. Global Agriscience Hyperspectral Imaging (HSI) Market Snapshot
Chapter 4. Global Agriscience Hyperspectral Imaging (HSI) Market Variables, Trends & Scope
4.1. Market Segmentation & Scope
4.2. Drivers
4.3. Challenges
4.4. Trends
4.5. Industry Analysis – Porter’s Five Forces Analysis
4.6. Competitive Landscape & Market Share Analysis
4.7. Technology Advancement in Agriscience Hyperspectral Imaging (HSI) Market
4.8. Key Trends in the Market
Chapter 5. Market Segmentation 1: Type Estimates & Trend Analysis
5.1. Type & Market Share, 2019 & 2031
5.2. Market Size (Value US$ Mn) & Forecasts and Trend Analyses, 2023 to 2031 for the following Type:
5.2.1. Visible Light + Near Infrared
5.2.2. Short Infrared Wave
Chapter 6. Market Segmentation 2: Application Estimates & Trend Analysis
6.1. Application & Market Share, 2020 & 2028
6.2. Market Size (Value US$ Mn) & Forecasts and Trend Analyses, 2020 to 2028 for the following Application:
6.2.1. Agricultural Robots/ Agricultural Vehicles
6.2.2. Drones
Chapter 7. Agriscience Hyperspectral Imaging (HSI) Market Segmentation 3: Regional Estimates & Trend Analysis
7.1. North America
7.1.1. North America Agriscience Hyperspectral Imaging (HSI) Market revenue (US$ Million) estimates and forecasts by Type, 2023-2031
7.1.2. North America Agriscience Hyperspectral Imaging (HSI) Market revenue (US$ Million) estimates and forecasts by Application, 2023-2031
7.1.3. North America Agriscience Hyperspectral Imaging (HSI) Market revenue (US$ Million) estimates and forecasts by country, 2023-2031
7.1.3.1. U.S.
7.1.3.2. Canada
7.2. Europe
7.2.1. Europe Agriscience Hyperspectral Imaging (HSI) Market revenue (US$ Million) by Type, 2023-2031
7.2.2. Europe Agriscience Hyperspectral Imaging (HSI) Market revenue (US$ Million) by Application, 2023-2031
7.2.3. Europe Agriscience Hyperspectral Imaging (HSI) Market revenue (US$ Million) by country, 2023-2031
7.2.3.1. Germany
7.2.3.2. France
7.2.3.3. Italy
7.2.3.4. Spain
7.2.3.5. UK
7.2.3.6. Rest of Europe
7.3. Asia Pacific
7.3.1. Asia Pacific Agriscience Hyperspectral Imaging (HSI) Market revenue (US$ Million) by Type, 2023-2031
7.3.2. Europe Agriscience Hyperspectral Imaging (HSI) Market revenue (US$ Million) by Application, 2023-2031
7.3.3. Asia Pacific Agriscience Hyperspectral Imaging (HSI) Market revenue (US$ Million) by country, 2023-2031
7.3.3.1. China
7.3.3.2. India
7.3.3.3. Japan
7.3.3.4. Australia
7.3.3.5. Rest of Asia Pacific
7.4. Latin America
7.4.1. Latin America Agriscience Hyperspectral Imaging (HSI) Market revenue (US$ Million) by Type, (US$ Million)
7.4.2. Europe Agriscience Hyperspectral Imaging (HSI) Market revenue (US$ Million) by Application, 2023-2031
7.4.3. Latin America Agriscience Hyperspectral Imaging (HSI) Market revenue (US$ Million) by country, (US$ Million) 2023-2031
7.4.3.1. Brazil
7.4.3.2. Rest of Latin America
7.5. MEA
7.5.1. MEA revenue Agriscience Hyperspectral Imaging (HSI) Market revenue (US$ Million) by Type, (US$ Million) 2023-2031
7.5.2. Europe Agriscience Hyperspectral Imaging (HSI) Market revenue (US$ Million) by Application, 2023-2031
7.5.3. MEA revenue Agriscience Hyperspectral Imaging (HSI) Market revenue (US$ Million) by country, (US$ Million) 2023-2031
7.5.3.1. GCC Countries
7.5.3.2. South Africa
7.5.3.3. Rest of MEA
Chapter 8. Competitive Landscape
8.1. Major Mergers and Acquisitions/Strategic Alliances
8.2. Company Profiles
8.2.1. Headwall Photonics, Inc.
8.2.2. SPECIM, Spectral Imaging Ltd.
8.2.3. IMEC
8.2.4. Corning Incorporated
8.2.5. Resonon Inc.
8.2.6. Telops Inc.
8.2.7. HyVista Corporation
8.2.8. Cubert GmbH
8.2.9. Surface Optics
8.2.10. Zolix
8.2.11. BaySpec
8.2.12. ITRES
8.2.13. Norsk Elektro Optikk A/S
8.2.14. Wayho Technology
8.2.15. TruTag?HinaLea Imaging?
8.2.16. Brimrose
8.2.17. Spectra Vista
8.2.18. Other Prominent Player