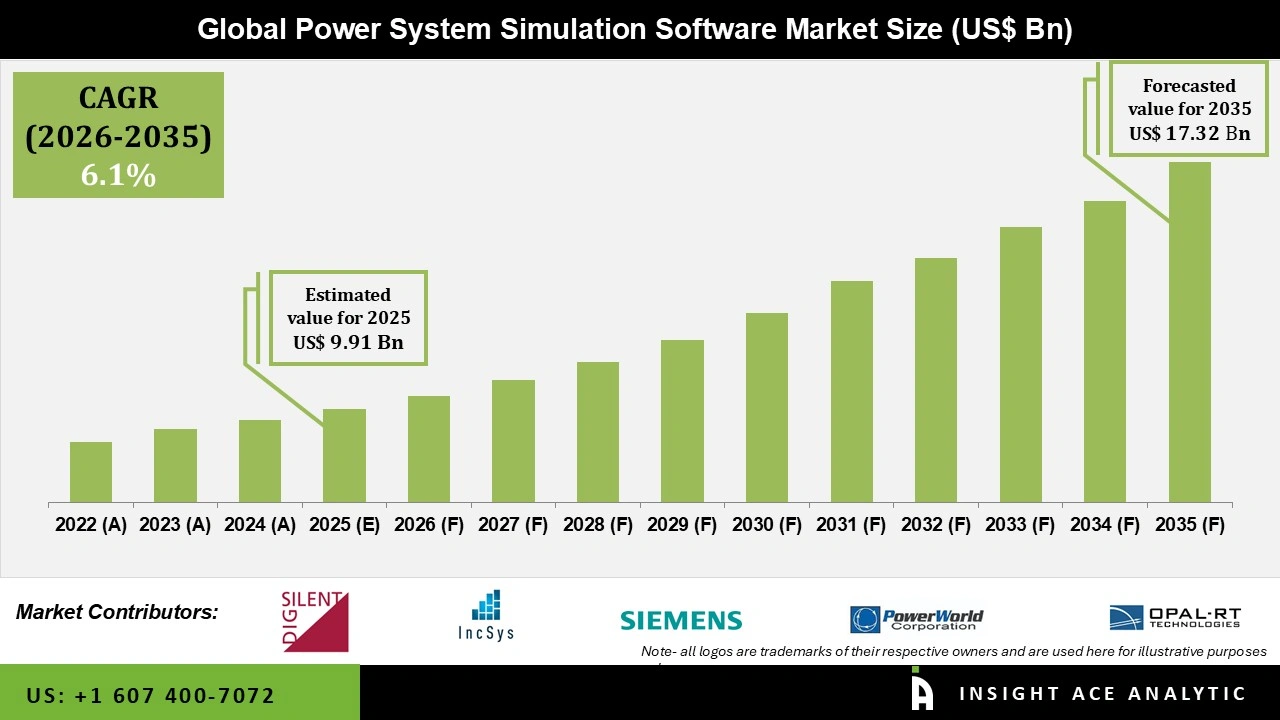
Global Power System Simulation Software Market Size is valued at USD 9.91 Bn in 2025 and is predicted to reach USD 17.32 Bn by the year 2035 at an 6.1% CAGR during the forecast period for 2026 to 2035.
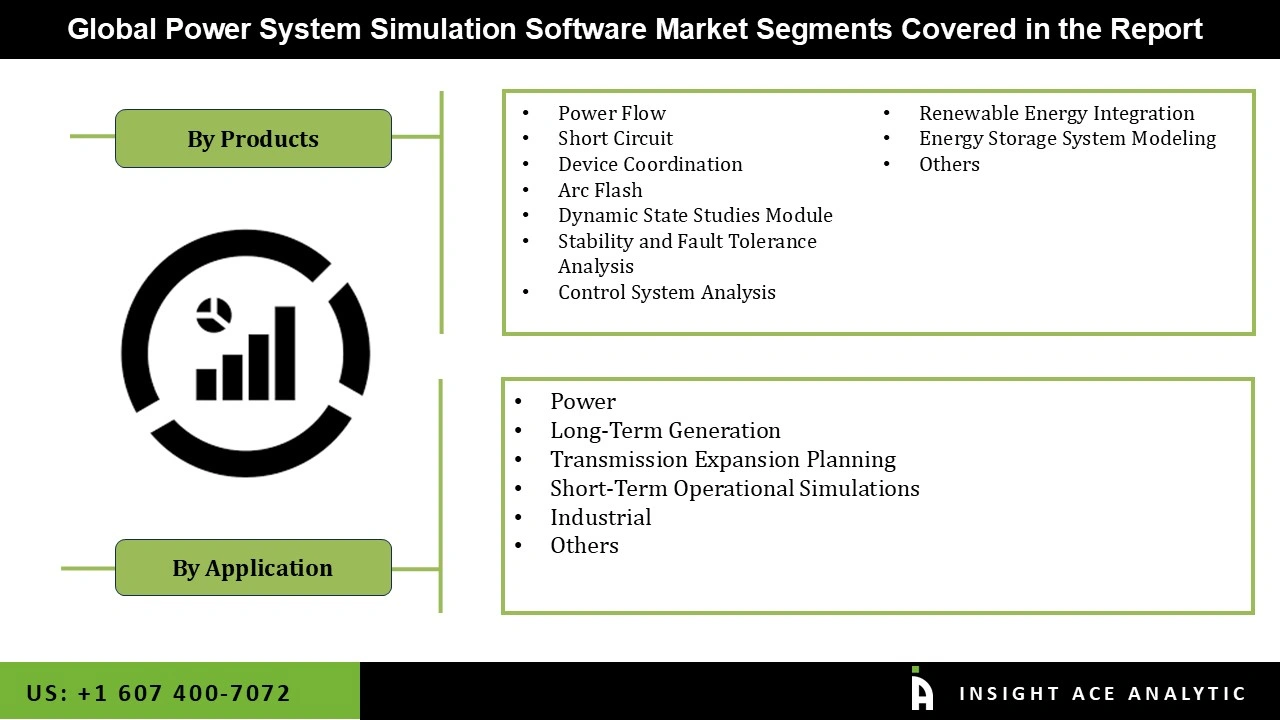
Power System Simulation Software Market Size, Share & Trends Analysis Distribution by Application (Power, Industrial, Others), Products (Power Flow, Short Circuit, Device Coordination, Arc Flash, Dynamic State Studies Module, Renewable Energy Integration, Energy Storage System Modeling, Others) and Segment Forecasts, 2026 to 2035.

The Power System Simulation Software Market is an essential and rapidly advancing segment within the energy industry, enabling engineers and researchers to model, analyze, and optimize power systems crucial for reliable electricity generation, transmission, and distribution. Such software replicates the behavior of electrical grids under different conditions, which would enable load flow studies, fault analysis, and dynamic simulations. This ability allows engineers to assess the performance of power systems in response to changes in demand, generation sources, and operational strategies. It is very helpful when renewable energy is incorporated into existing grids and strengthens the system's resilience.
The applications of power system simulation software are very wide, from grid planning to operational efficiency, renewable energy integration, and training and education. For instance, the software can be used in the design and expansion of power networks, optimize the performance of a system, assess the impact of renewable energy on grid stability, and provide a virtual training environment for engineers and operators. Global demand for electricity is primarily driven by population growth and expansion in economies, which boosts the market. This upward trend in demand creates a stimulus for investment in the latest simulation technologies, as utilities look to optimize their operations and plan strategically for future energy needs.
The power system simulation software market is segmented by application and product. By application the market is segmented into power, industrial, others, power is sub segmented into long-term generation, transmission expansion planning, short-term operational simulations. By products market is categorized into power flow, short circuit, device coordination, arc flash, dynamic state studies module. Dynamic state studies module is sub segmented into stability and fault tolerance analysis, control system analysis.
The power segment is the main driver for the Power System Simulation Software Market, and the growth factors include the integration of renewable energy and advanced grid management. Global electricity demand is rising, mainly due to urbanization and technological progress, and utilities are using simulation software to optimize generation capacity, enhance transmission efficiency, and meet this demand reliably. With the changing face of energy by renewable sources including wind and solar, continued variability challenges grid stability. Power system simulation tools offer utilities to consider how renewables can be better integrated into the system with tools to manage Variable Renewable Energy with energy storage and flexible generation. Tools also enhance a means to increase grid resiliency, including better understanding of how systems react in an outage or variation in demand, a pressing need as systems become complex.
The Renewable Energy Integration segment is a significant growth driver in the Power System Simulation Software Market, driven by the shift in the global trend towards renewable energy, the demand for advanced modeling tools, and supportive regulations. Since the countries are emphasizing more on renewable energy, sources like solar and wind, integrated into the existing grids, have become the necessity but are challenging because they vary. Simulation software helps utilities model renewable behavior, optimize integration, and ensure grid stability. In addition, advanced simulators make it possible to predict the performance of systems under a variety of conditions, guaranteeing reliable grid operations even in the face of increasing renewable sources. Regulatory support adds to this demand, with mandates forcing utilities to add more renewables as they meet environmental targets. As such, the requirement for strong simulation tools will continue to grow as utilities address the challenge of renewable integration.
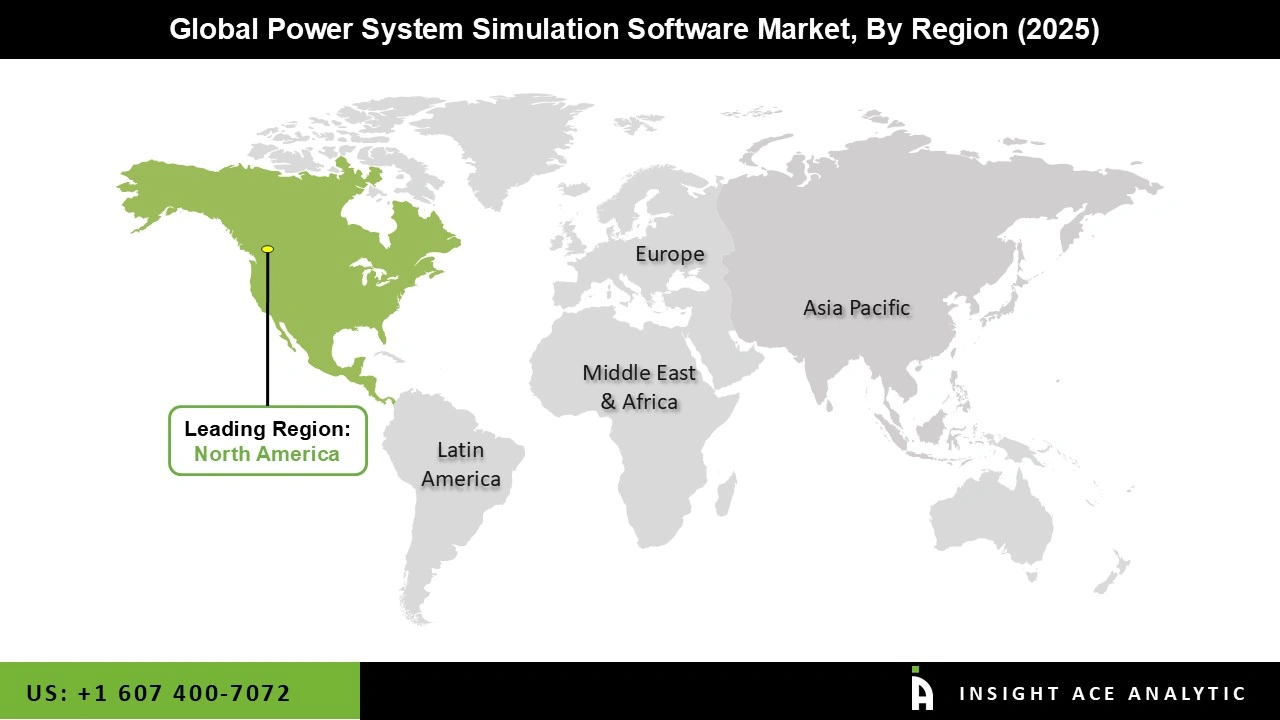
North America is the dominant player in the Power System Simulation Software Market, which can be attributed to its developed technological infrastructure, high investment in smart grids, robust demand for reliable power, and supportive government policies. Developed tech infrastructure in the region allows for wide penetration of sophisticated simulation tools. Huge investments in smart grid technologies, including advanced sensors, communication networks, and automation systems, are contingent upon power system simulators for effective design and testing.

The residential and commercial sectors also have a major demand for a stable supply of power, which means the adoption of simulation software for efficient resource management and prevention of outages is driven. In addition to this, government policies with respect to grid modernization and energy efficiency are substantial sources of funding for R&D, and partnerships among the governments, academia, and private sectors really enhance the prospects of the market.
| Report Attribute | Specifications |
| Market Size Value In 2025 | USD 9.91 Bn |
| Revenue Forecast In 2035 | USD 17.32 Bn |
| Growth Rate CAGR | CAGR of 6.1% from 2026 to 2035 |
| Quantitative Units | Representation of revenue in US$ Bn and CAGR from 2026 to 2035 |
| Historic Year | 2022 to 2025 |
| Forecast Year | 2026-2035 |
| Report Coverage | The forecast of revenue, the position of the company, the competitive market structure, growth prospects, and trends |
| Segments Covered | By Application, Products and By Region |
| Regional Scope | North America; Europe; Asia Pacific; Latin America; Middle East & Africa |
| Country Scope | U.S.; Canada; U.K.; Germany; China; India; Japan; Brazil; Mexico; The UK; France; Italy; Spain; South Korea; Southeast Asia |
| Competitive Landscape | Siemens, OPAL-RT TECHNOLOGIES, Inc., DIgSILENT, PowerWorld Corporation, IncSys, Inc., Manitoba Hydro International Ltd., RTDS Technologies Inc., The MathWorks, Inc., ABB, General Electric Company, Schneider Electric, Plexim GmbH, DNV GL, Fuji Electric Co., Ltd., CYME International, PGSTech, Neplan AG, Open Systems International (AspenTech), Nayak Corporation |
| Customization Scope | Free customization report with the procurement of the report, Modifications to the regional and segment scope. Geographic competitive landscape. |
| Pricing and Available Payment Methods | Explore pricing alternatives that are customized to your particular study requirements. |

This study employed a multi-step, mixed-method research approach that integrates:
This approach ensures a balanced and validated understanding of both macro- and micro-level market factors influencing the market.
Secondary research for this study involved the collection, review, and analysis of publicly available and paid data sources to build the initial fact base, understand historical market behaviour, identify data gaps, and refine the hypotheses for primary research.
Secondary data for the market study was gathered from multiple credible sources, including:
These sources were used to compile historical data, market volumes/prices, industry trends, technological developments, and competitive insights.

Primary research was conducted to validate secondary data, understand real-time market dynamics, capture price points and adoption trends, and verify the assumptions used in the market modelling.
Primary interviews for this study involved:
Interviews were conducted via:
Primary insights were incorporated into demand modelling, pricing analysis, technology evaluation, and market share estimation.
All collected data were processed and normalized to ensure consistency and comparability across regions and time frames.
The data validation process included:
This ensured that the dataset used for modelling was clean, robust, and reliable.
The bottom-up approach involved aggregating segment-level data, such as:
This method was primarily used when detailed micro-level market data were available.

The top-down approach used macro-level indicators:
This approach was used for segments where granular data were limited or inconsistent.
To ensure accuracy, a triangulated hybrid model was used. This included:
This multi-angle validation yielded the final market size.
Market forecasts were developed using a combination of time-series modelling, adoption curve analysis, and driver-based forecasting tools.
Given inherent uncertainties, three scenarios were constructed:
Sensitivity testing was conducted on key variables, including pricing, demand elasticity, and regional adoption.