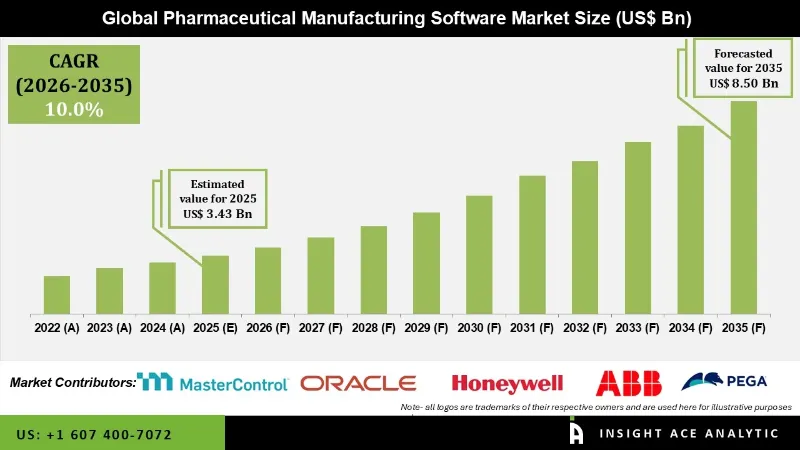
Pharmaceutical Manufacturing Software Market Size is valued at USD 3.43 Bn in 2025 and is predicted to reach USD 8.50 Bn by the year 2035 at an 10.0% CAGR during the forecast period for 2026 to 2035.
Pharmaceutical Manufacturing Software Market Size, Share & Trends Analysis Distribution by Deployment Type (On-cloud, On-premise), Application (Large Enterprises, Small and Midsize Enterprises), End User (Biopharmaceutical Companies, Medical Device Companies, Contract Research Organizations, Academic Research Institutions) and Segment Forecasts, 2026 to 2035

Pharmaceutical manufacturing software is the backbone of the pharmaceutical industry because it helps to streamline and ensures the processes go in line with such rigid regulatory standards. The applications involved include inventory management, batch tracking, recipe management, process automation, and quality control functions. Aggregated, these functions allow pharmaceutical manufacturing companies to monitor their production processes effectively and assert control. The core functionalities such as tracking raw materials, overseeing production batches, and managing complex formulations provide consistent quality and regulations.
Use of pharmaceutical manufacturing software is highly encouraged in the context of such a stringent regulatory environment. For instance, the FDA and the EMA would need an adequate and step-by-step record of every process-from raw material purchase to product delivery. Software solutions support these needs through proper record-keeping and traceability, supporting companies in their quest to fulfill the demands of compliance. Predictive analytics and real-time monitoring also added functionalities, as advancements in AI and machine learning added to overall efficiency in compliance and operations.
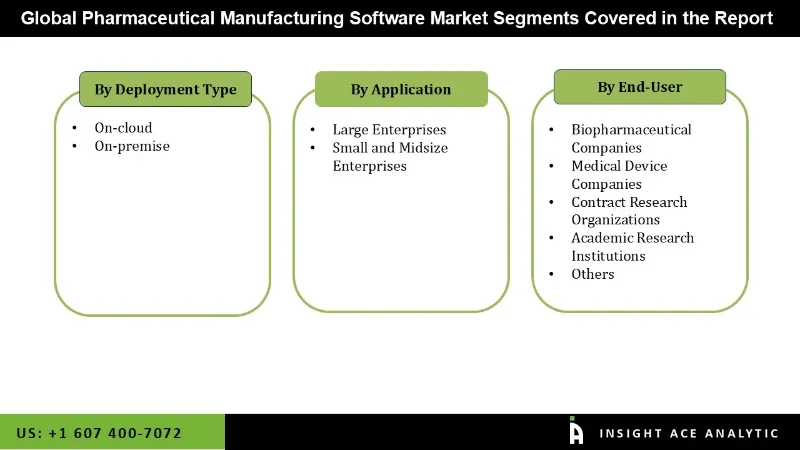
The pharmaceutical manufacturing software market is segmented by deployment type, application, and end user. By deployment type the market is segmented on-cloud, on-premise. By application market is categorized into large enterprises, small and midsize enterprises. By end user the market is categorized into biopharmaceutical companies, medical device companies, contract research organizations, academic research institutions, others.
The on-cloud deployment of pharmaceutical manufacturing software is changing the face of the industry from cost-effective, highly accessible, scalable, and secure data-protection solutions to the current needs of this industry. Cloud solutions eliminate the need for physical infrastructure and therefore lower the cost of operation and make advanced technology available for this through a subscription model. This setup allows teams to work remotely and collaborate effortlessly-a stark need in today's fast-paced, decentralized work environment.
Cloud solutions provide unparalleled scalability, so pharmaceutical companies can scale resources rapidly based on market demand or regulatory requirements. Their data centers also provide encryption of all data and will be safe with multi-factor authentication; thus, they allow for compliance with regulatory standards by keeping automated documentation and audit trails for quicker inspection and reduced compliance overhead.
The biopharmaceutical segment within the pharmaceutical manufacturing software market is experiencing rapid growth due to factors such as rising demand for biologics, vaccines, and advanced therapies driven by aging populations and chronic disease prevalence. Biopharmaceutical manufacturing involves a rather complex process of cell culture and purification, therefore requiring appropriate software that will enable real-time monitoring and batch tracking to facilitate complexity management compliance.
Additionally, the stringent regulatory requirements that emphasize the presence of a QMS and automated compliance documentation continue to drive the demand for software solutions that integrate data sharing and communication. Also, the rise of CMOs-which most biopharmaceutical companies use for cost-effectiveness and flexibility-and further supports the direction of the high demand for software solutions that can be of help in smoothening data sharing and communication.
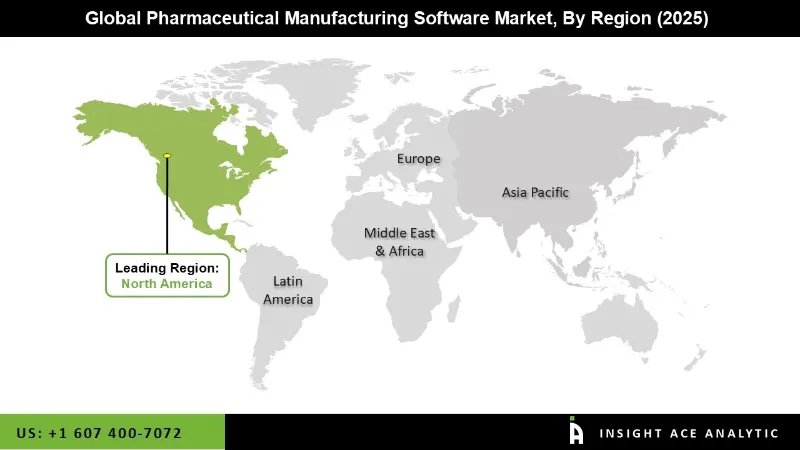
North America has the largest share in the pharmaceutical manufacturing software market due to the region's many big pharmaceutical companies, of which a large number are in the U.S. and Canada, that invest in complex technologies for maximizing efficiency. The regulatory environment is also quite harsh in the region, with agencies such as the FDA requiring software that can help support Good Manufacturing Practices (cGMP) compliance, ensure proper documentation, and auditing among other requirements.

Further, due to high health expenses in North America, pharmaceutical companies can afford to keep a considerable share of budget towards automation and process optimization technologies. This fast adoption of digital transformation tools, such as cloud-based solutions and data analytics, allows for the monitoring of real-time situations and access to facilities located remotely, and further enables data-driven decision-making to take full advantage of operational efficiency in pharma manufacturing.
| Report Attribute | Specifications |
| Market Size Value In 2025 | USD 3.43 Bn |
| Revenue Forecast In 2035 | USD 8.50 Bn |
| Growth Rate CAGR | CAGR of 10.0% from 2026 to 2035 |
| Quantitative Units | Representation of revenue in US$ Bn and CAGR from 2026 to 2035 |
| Historic Year | 2022 to 2024 |
| Forecast Year | 2026-2035 |
| Report Coverage | The forecast of revenue, the position of the company, the competitive market structure, growth prospects, and trends |
| Segments Covered | By Deployment Type, Application, End User, and By Region |
| Regional Scope | North America; Europe; Asia Pacific; Latin America; Middle East & Africa |
| Country Scope | U.S.; Canada; U.K.; Germany; China; India; Japan; Brazil; Mexico; France; Italy; Spain; South Korea; Southeast Asia |
| Competitive Landscape | Oracle Corporation, Pegasystems Inc, MasterControl Inc., Veeva Systems Inc, Siemens AG, Honeywell International Inc, Werum IT Solutions GmbH, Dassault Systèmes, Emerson Electric Co, Rockwell Automation Inc., Parsec Automation Corp, ABB Ltd, Aspen Technology Inc, Schneider Electric SE, Körber AG, Sparta Systems Inc., QAD Inc., Kinaxis Inc. |
| Customization Scope | Free customization report with the procurement of the report, Modifications to the regional and segment scope. Geographic competitive landscape. |
| Pricing and Available Payment Methods | Explore pricing alternatives that are customized to your particular study requirements. |
Pharmaceutical Manufacturing Software Market by Deployment Type -

Pharmaceutical Manufacturing Software Market by Application -
Pharmaceutical Manufacturing Software Market by End User -
Pharmaceutical Manufacturing Software Market by Region-
North America-
Europe-
Asia-Pacific-
Latin America-
Middle East & Africa-
This study employed a multi-step, mixed-method research approach that integrates:
This approach ensures a balanced and validated understanding of both macro- and micro-level market factors influencing the market.
Secondary research for this study involved the collection, review, and analysis of publicly available and paid data sources to build the initial fact base, understand historical market behaviour, identify data gaps, and refine the hypotheses for primary research.
Secondary data for the market study was gathered from multiple credible sources, including:
These sources were used to compile historical data, market volumes/prices, industry trends, technological developments, and competitive insights.

Primary research was conducted to validate secondary data, understand real-time market dynamics, capture price points and adoption trends, and verify the assumptions used in the market modelling.
Primary interviews for this study involved:
Interviews were conducted via:
Primary insights were incorporated into demand modelling, pricing analysis, technology evaluation, and market share estimation.
All collected data were processed and normalized to ensure consistency and comparability across regions and time frames.
The data validation process included:
This ensured that the dataset used for modelling was clean, robust, and reliable.
The bottom-up approach involved aggregating segment-level data, such as:
This method was primarily used when detailed micro-level market data were available.

The top-down approach used macro-level indicators:
This approach was used for segments where granular data were limited or inconsistent.
To ensure accuracy, a triangulated hybrid model was used. This included:
This multi-angle validation yielded the final market size.
Market forecasts were developed using a combination of time-series modelling, adoption curve analysis, and driver-based forecasting tools.
Given inherent uncertainties, three scenarios were constructed:
Sensitivity testing was conducted on key variables, including pricing, demand elasticity, and regional adoption.