Global Enterprise Imaging IT Market Size is valued at US$ 2.3 Bn in 2024 and is predicted to reach US$ 8.5 Bn by the year 2034 at an 14.1% CAGR during the forecast period for 2025-2034.
Enterprise Imaging IT is a centralized strategy and technology platform that consolidates all medical images and clinical multimedia (from radiology, cardiology, dermatology, etc.) across a healthcare system. Its goal is to make every image universally accessible to any authorized provider through the electronic health record (EHR) to improve care coordination and decision-making.
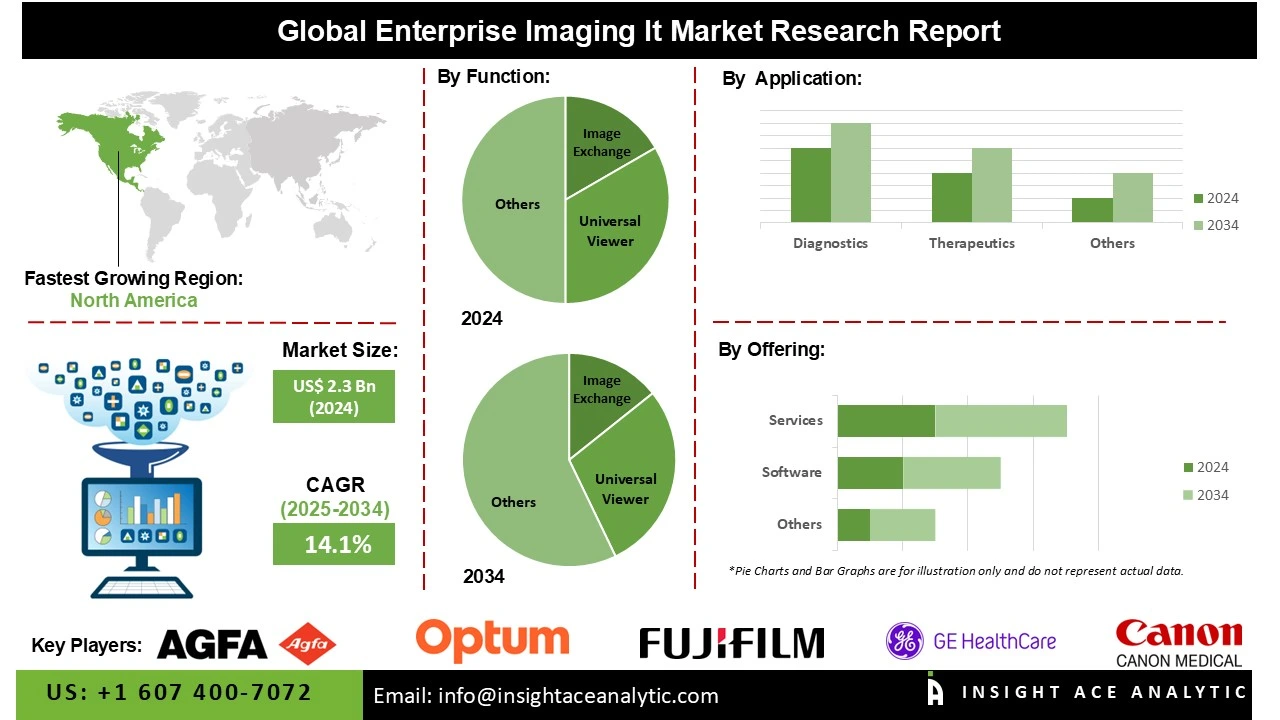
Enterprise imaging solutions integrate a number of imaging modalities into a single platform, allowing specialists to access, share, and analyze patient images effectively. Cross-specialty access improves clinical decision-making, reduces treatment planning delays, and supports precision medicine. Increasing cancer prevalence and the requirement for multidisciplinary treatment are key drivers propelling this trend towards enterprise imaging adoption.
The Enterprise Imaging IT market is experiencing robust growth based on increasing use of mobile diagnostic imaging. Mobile imaging technologies provide quicker access to vital diagnostic information so that healthcare providers are able to provide timely care, especially in rural and underserved locations. The portability of mobile platforms facilitates point-of-care diagnostics, decreases travel for patients, and improves workflow effectiveness. Integration with enterprise IT systems for imaging in hospitals and clinics ensures smooth sharing of data between hospitals and clinics, allowing collaborative decision-making. The growing need for low-cost, portable, and accessible imaging technologies is forcing healthcare organizations to invest in sophisticated enterprise imaging IT platforms.
Some of the Key Players in the Enterprise Imaging IT Market:
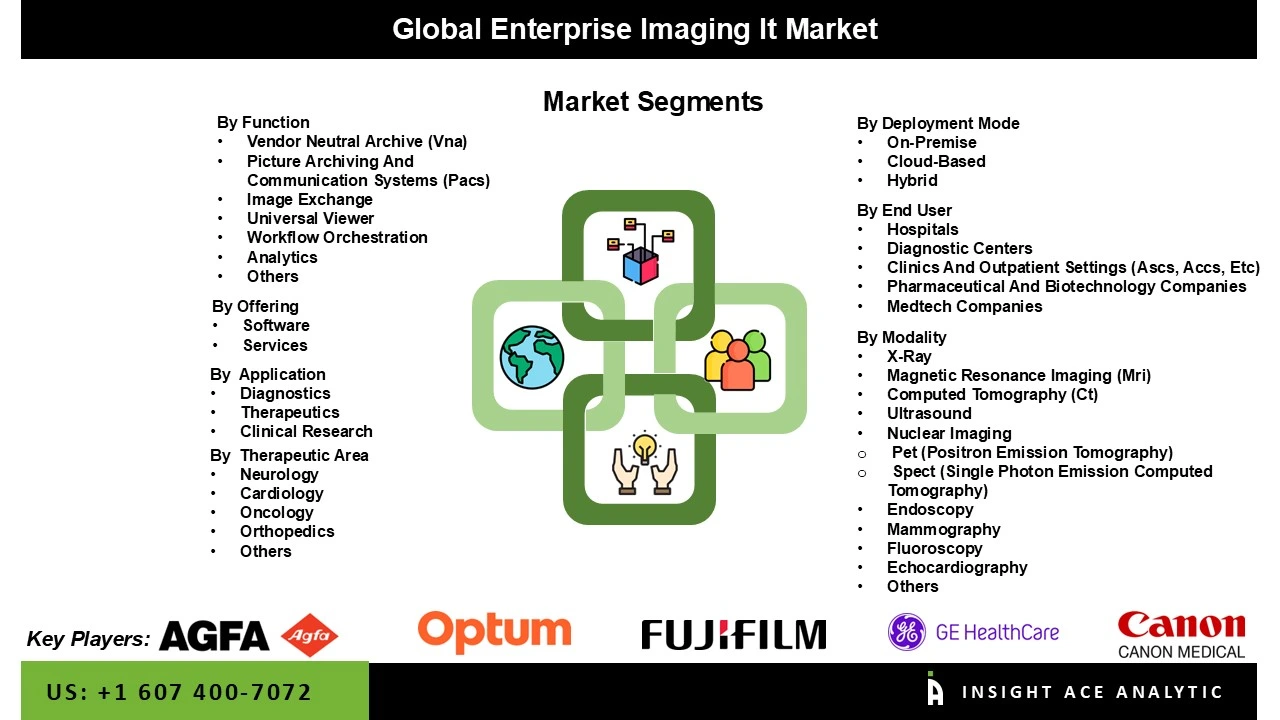
The enterprise imaging IT market is segmented by function, modality, application, offering, deployment mode, therapeutic area, end-user and By Region. The enterprise imaging IT market is segmented into multiple categories. It is divided by function, which includes vendor neutral archive (VNA), picture archiving & communication systems (PACS), image exchange, universal viewer, workflow orchestration, analytics, and others. Segmentation by modality covers X-Ray, MRI, CT, ultrasound, nuclear imaging, endoscopy, mammography, fluoroscopy, and echocardiography. Furthermore, the market is categorized by application (diagnostic, therapeutics, clinical research), offering (software, services), and therapeutic area (neurology, cardiology, oncology, orthopedics). Additional segments include deployment mode (on-premises, cloud-based, hybrid) and end-user (hospitals, diagnostic centers, clinics, outpatient settings, pharmaceutical and biotechnology companies, medtech companies, research & academia). Finally, the market is also analyzed by region.
In 2024, the growing need for centralized management of medical images across multiple departments and facilities expand market growth. Healthcare providers are shifting toward interoperable, vendor-agnostic solutions to eliminate data silos, reduce storage costs, and enhance accessibility. Rising adoption of electronic health records (EHRs), compliance with regulatory standards, and the rising demand for seamless image sharing across care networks further accelerate VNA adoption, improving workflow efficiency and patient care delivery.
The enterprise imaging IT market is dominated by software due to the growing need for centralized management of medical imaging data across healthcare enterprises. Hospitals and clinics are shifting from siloed PACS to enterprise-wide platforms that integrate radiology, cardiology, pathology, and other specialties into a unified system. This ensures seamless data sharing, improves collaboration, and enhances clinical decision-making. Rising patient volumes, demand for faster diagnostics, and the push toward value-based care further accelerate adoption. Additionally, regulatory requirements for interoperability and the integration of artificial intelligence (AI) for advanced imaging analytics strengthen market growth.
North America dominates the market for enterprise imaging IT due to region’s increasing demand for comprehensive healthcare systems integrating imaging data between various departments facilitates effective clinical collaboration. Increasing acceptance of electronic health records (EHRs) and value-based care models is driving demand for solutions which combine disparate imaging formats into one patient-centric record. Increased use of cloud-based storage and AI-powered diagnostics is improving accessibility and clinical decision-making. Growing healthcare expenditure, combined with government focus on interoperability and patient data protection, accelerates adoption within hospitals, diagnostic centres, and specialty clinics in the market.
Europe is the second-largest region in the market for enterprise imaging IT. This is attributed to growing need for integrated healthcare systems that centralize imaging data across departments to improve clinical workflows and patient care. Growing use of electronic health records (EHRs) and integration of Picture Archiving and Communication Systems (PACS) facilitates smooth image exchange, eliminating duplications and delays in diagnosis. Growing incidence of chronic ailments and geriatric populations drive the need for sophisticated diagnostic imaging products. In addition, government focus on data interoperability, along with increasing expenditure in digital healthcare infrastructure and cloud-based imaging platforms, deeply propels regional market growth.
Chapter 1. Methodology and Scope
1.1. Research Methodology
1.2. Research Scope & Assumptions
Chapter 2. Executive Summary
Chapter 3. Global Enterprise Imaging It Market Snapshot
Chapter 4. Global Enterprise Imaging It Market Variables, Trends & Scope
4.1. Market Segmentation & Scope
4.2. Drivers
4.3. Challenges
4.4. Trends
4.5. Investment and Funding Analysis
4.6. Porter's Five Forces Analysis
4.7. Incremental Opportunity Analysis (US$ MN), 2025-2034
4.8. Competitive Landscape & Market Share Analysis, By Key Player (2024)
4.9. Use/impact of AI on Enterprise Imaging It Market Industry Trends
4.10. Global Enterprise Imaging It Market Penetration & Growth Prospect Mapping (US$ Mn), 2024-2034
Chapter 5. Enterprise Imaging It Market Segmentation 1: By Function, Estimates & Trend Analysis
5.1. Market Share by Function, 2024 & 2034
5.2. Market Size Revenue (US$ Million) & Forecasts and Trend Analyses, 2021 to 2034 for the following Function:
5.2.1. Vendor Neutral Archive (Vna)
5.2.2. Picture Archiving And Communication Systems (Pacs)
5.2.3. Image Exchange
5.2.4. Universal Viewer
5.2.5. Workflow Orchestration
5.2.6. Analytics
5.2.7. Others
Chapter 6. Enterprise Imaging It Market Segmentation 2: By End-User, Estimates & Trend Analysis
6.1. Market Share by End-User, 2024 & 2034
6.2. Market Size Revenue (US$ Million) & Forecasts and Trend Analyses, 2021 to 2034 for the following End-User:
6.2.1. Hospitals
6.2.2. Diagnostic Centers
6.2.3. Clinics And Outpatient Settings (Ascs, Accs, Etc)
6.2.4. Pharmaceutical And BioModality Companies
6.2.5. Medtech Companies
6.2.6. Research And Academia
6.2.7. Others
Chapter 7. Enterprise Imaging It Market Segmentation 3: By Application, Estimates & Trend Analysis
7.1. Market Share by Application, 2024 & 2034
7.2. Market Size Revenue (US$ Million) & Forecasts and Trend Analyses, 2021 to 2034 for the following Application:
7.2.1. Diagnostics
7.2.2. Therapeutics
7.2.3. Clinical Research
Chapter 8. Enterprise Imaging It Market Segmentation 4: By Offering, Estimates & Trend Analysis
8.1. Market Share by Offering, 2024 & 2034
8.2. Market Size Revenue (US$ Million) & Forecasts and Trend Analyses, 2021 to 2034 for the following Offering:
8.2.1. Software
8.2.2. Services
Chapter 9. Enterprise Imaging It Market Segmentation 5: By Therapeutic Area, Estimates & Trend Analysis
9.1. Market Share by Therapeutic Area, 2024 & 2034
9.2. Market Size Revenue (US$ Million) & Forecasts and Trend Analyses, 2021 to 2034 for the following Therapeutic Area:
9.2.1. Neurology
9.2.2. Cardiology
9.2.3. Oncology
9.2.4. Orthopedics
9.2.5. Others
Chapter 10. Enterprise Imaging It Market Segmentation 6: By Deployment Mode, Estimates & Trend Analysis
10.1. Market Share by Deployment Mode, 2024 & 2034
10.2. Market Size Revenue (US$ Million) & Forecasts and Trend Analyses, 2021 to 2034 for the following Deployment Mode:
10.2.1. Cloud-Based
10.2.2. On-Premise
10.2.3. Hybrid
Chapter 11. Enterprise Imaging It Market Segmentation 7: By Modality, Estimates & Trend Analysis
11.1. Market Share by Modality, 2024 & 2034
11.2. Market Size Revenue (US$ Million) & Forecasts and Trend Analyses, 2021 to 2034 for the following Modality:
11.2.1. X-Ray
11.2.2. Magnetic Resonance Imaging (Mri)
11.2.3. Computed Tomography (Ct)
11.2.4. Ultrasound
11.2.5. Nuclear Imaging
11.2.5.1. Pet (Positron Emission Tomography)
11.2.5.2. Spect (Single Photon Emission Computed Tomography)
11.2.6. Endoscopy
11.2.7. Mammography
11.2.8. Fluoroscopy
11.2.9. Echocardiography
11.2.10. Others
Chapter 12. Enterprise Imaging It Market Segmentation 8: Regional Estimates & Trend Analysis
12.1. Global Enterprise Imaging It Market, Regional Snapshot 2024 & 2034
12.2. North America
12.2.1. North America Enterprise Imaging It Market Revenue (US$ Million) Estimates and Forecasts by Country, 2021-2034
12.2.1.1. US
12.2.1.2. Canada
12.2.2. North America Enterprise Imaging It Market Revenue (US$ Million) Estimates and Forecasts by Function, 2021-2034
12.2.3. North America Enterprise Imaging It Market Revenue (US$ Million) Estimates and Forecasts by End-User, 2021-2034
12.2.4. North America Enterprise Imaging It Market Revenue (US$ Million) Estimates and Forecasts by Application, 2021-2034
12.2.5. North America Enterprise Imaging It Market Revenue (US$ Million) Estimates and Forecasts by Offering, 2021-2034
12.2.6. North America Enterprise Imaging It Market Revenue (US$ Million) Estimates and Forecasts by Therapeutic Area, 2021-2034
12.2.7. North America Enterprise Imaging It Market Revenue (US$ Million) Estimates and Forecasts by Deployment Mode, 2021-2034
12.2.8. North America Enterprise Imaging It Market Revenue (US$ Million) Estimates and Forecasts by Modality, 2021-2034
12.3. Europe
12.3.1. Europe Enterprise Imaging It Market Revenue (US$ Million) Estimates and Forecasts by Country, 2021-2034
12.3.1.1. Germany
12.3.1.2. U.K.
12.3.1.3. France
12.3.1.4. Italy
12.3.1.5. Spain
12.3.1.6. Rest of Europe
12.3.2. Europe Enterprise Imaging It Market Revenue (US$ Million) Estimates and Forecasts by Function, 2021-2034
12.3.3. Europe Enterprise Imaging It Market Revenue (US$ Million) Estimates and Forecasts by End-User, 2021-2034
12.3.4. Europe Enterprise Imaging It Market Revenue (US$ Million) Estimates and Forecasts by Application, 2021-2034
12.3.5. Europe Enterprise Imaging It Market Revenue (US$ Million) Estimates and Forecasts by Offering, 2021-2034
12.3.6. Europe Enterprise Imaging It Market Revenue (US$ Million) Estimates and Forecasts by Therapeutic Area, 2021-2034
12.3.7. Europe Enterprise Imaging It Market Revenue (US$ Million) Estimates and Forecasts by Deployment Mode, 2021-2034
12.3.8. Europe Enterprise Imaging It Market Revenue (US$ Million) Estimates and Forecasts by Modality, 2021-2034
12.4. Asia Pacific
12.4.1. Asia Pacific Enterprise Imaging It Market Revenue (US$ Million) Estimates and Forecasts by Country, 2021-2034
12.4.1.1. India
12.4.1.2. China
12.4.1.3. Japan
12.4.1.4. Australia
12.4.1.5. South Korea
12.4.1.6. Hong Kong
12.4.1.7. Southeast Asia
12.4.1.8. Rest of Asia Pacific
12.4.2. Asia Pacific Enterprise Imaging It Market Revenue (US$ Million) Estimates and Forecasts by Function, 2021-2034
12.4.3. Asia Pacific Enterprise Imaging It Market Revenue (US$ Million) Estimates and Forecasts by End-User, 2021-2034
12.4.4. Asia Pacific Enterprise Imaging It Market Revenue (US$ Million) Estimates and Forecasts by Application, 2021-2034
12.4.5. Asia Pacific Enterprise Imaging It Market Revenue (US$ Million) Estimates and Forecasts by Offering, 2021-2034
12.4.6. Asia Pacific Enterprise Imaging It Market Revenue (US$ Million) Estimates and Forecasts by Therapeutic Area, 2021-2034
12.4.7. Asia Pacific Enterprise Imaging It Market Revenue (US$ Million) Estimates and Forecasts by Deployment Mode, 2021-2034
12.4.8. Asia Pacific Enterprise Imaging It Market Revenue (US$ Million) Estimates and Forecasts by Modality, 2021-2034
12.5. Latin America
12.5.1. Latin America Enterprise Imaging It Market Revenue (US$ Million) Estimates and Forecasts by Country, 2021-2034
12.5.1.1. Brazil
12.5.1.2. Mexico
12.5.1.3. Rest of Latin America
12.5.2. Latin America Enterprise Imaging It Market Revenue (US$ Million) Estimates and Forecasts by Function, 2021-2034
12.5.3. Latin America Enterprise Imaging It Market Revenue (US$ Million) Estimates and Forecasts by End-User, 2021-2034
12.5.4. Latin America Enterprise Imaging It Market Revenue (US$ Million) Estimates and Forecasts by Application, 2021-2034
12.5.5. Latin America Enterprise Imaging It Market Revenue (US$ Million) Estimates and Forecasts by Offering, 2021-2034
12.5.6. Latin America Enterprise Imaging It Market Revenue (US$ Million) Estimates and Forecasts by Therapeutic Area, 2021-2034
12.5.7. Latin America Enterprise Imaging It Market Revenue (US$ Million) Estimates and Forecasts by Deployment Mode, 2021-2034
12.5.8. Latin America Enterprise Imaging It Market Revenue (US$ Million) Estimates and Forecasts by Modality, 2021-2034
12.6. Middle East & Africa
12.6.1. Middle East & Africa Wind Turbine Rotor Blade Market Revenue (US$ Million) Estimates and Forecasts by country, 2021-2034
12.6.1.1. GCC Countries
12.6.1.2. Israel
12.6.1.3. South Africa
12.6.1.4. Rest of Middle East and Africa
12.6.2. Middle East & Africa Enterprise Imaging It Market Revenue (US$ Million) Estimates and Forecasts by Function, 2021-2034
12.6.3. Middle East & Africa Enterprise Imaging It Market Revenue (US$ Million) Estimates and Forecasts by End-User, 2021-2034
12.6.4. Middle East & Africa Enterprise Imaging It Market Revenue (US$ Million) Estimates and Forecasts by Application, 2021-2034
12.6.5. Middle East & Africa Enterprise Imaging It Market Revenue (US$ Million) Estimates and Forecasts by Offering, 2021-2034
12.6.6. Middle East & Africa Enterprise Imaging It Market Revenue (US$ Million) Estimates and Forecasts by Therapeutic Area, 2021-2034
12.6.7. Middle East & Africa Enterprise Imaging It Market Revenue (US$ Million) Estimates and Forecasts by Deployment Mode, 2021-2034
12.6.8. Middle East & Africa Enterprise Imaging It Market Revenue (US$ Million) Estimates and Forecasts by Modality, 2021-2034
Chapter 13. Competitive Landscape
13.1. Major Mergers and Acquisitions/Strategic Alliances
13.2. Company Profiles
13.2.1. Agfa-Gevaert Group (Belgium)
13.2.1.1. Business Overview
13.2.1.2. Key Types/Service Overview
13.2.1.3. Financial Performance
13.2.1.4. Geographical Presence
13.2.1.5. Recent Developments with Business Strategy
13.2.2. FUJIFILM Corporation (Japan)
13.2.3. Merative (US)
13.2.4. Pro Medicus, Ltd. (Australia)
13.2.5. Optum, Inc. (US)
13.2.6. GE HealthCare (US)
13.2.7. Intelerad (Canada)
13.2.8. Sectra AB (Sweden)
13.2.9. CANON MEDICAL SYSTEMS CORPORATION (Japan)
13.2.10. Hyland Software, Inc. (US)
13.2.11. Koninklijke Philips N.V. (Netherlands)
13.2.12. Siemens Healthineers AG (Germany)
Enterprise Imaging IT Market by Function-
· Vendor Neutral Archive (VNA)
· Picture Archiving & Communication Systems (PACS)
· Image Exchange
· Universal Viewer
· Workflow Orchestration
· Analytics
· Others
Enterprise Imaging IT Market by Modality -
· X-Ray
· MRI
· CT
· Ultrasound
· Nuclear Imaging, Endoscopy
· Mammography
· Fluoroscopy
· Echocardiography
· Others
Enterprise Imaging IT Market by Application-
· Diagnostic
· Therapeutics
· Clinical Research
Enterprise Imaging IT Market by Offering-
· Software
· Services
Enterprise Imaging IT Market by Deployment Mode-
· On-Premises
· Cloud-Based
· Hybrid
Enterprise Imaging IT Market by Therapeutic Area-
· Neurology
· Cardiology
· Oncology
· Orthopedics
· Others
Enterprise Imaging IT Market by End-User-
· Hospitals
· Diagnostic Centers
· Clinics & Outpatient Settings (ASCS, ACCS, Etc)
· Pharmaceutical & Biotechnology Companies
· Medtech Companies
· Research & Academia
· Others
Enterprise Imaging IT Market by Region-
North America-
· The US
· Canada
Europe-
· Germany
· The UK
· France
· Italy
· Spain
· Rest of Europe
Asia-Pacific-
· China
· Japan
· India
· South Korea
· Southeast Asia
· Rest of Asia Pacific
Latin America-
· Brazil
· Argentina
· Mexico
· Rest of Latin America
Middle East & Africa-
· GCC Countries
· South Africa
· Rest of the Middle East and Africa
InsightAce Analytic follows a standard and comprehensive market research methodology focused on offering the most accurate and precise market insights. The methods followed for all our market research studies include three significant steps – primary research, secondary research, and data modeling and analysis - to derive the current market size and forecast it over the forecast period. In this study, these three steps were used iteratively to generate valid data points (minimum deviation), which were cross-validated through multiple approaches mentioned below in the data modeling section.
Through secondary research methods, information on the market under study, its peer, and the parent market was collected. This information was then entered into data models. The resulted data points and insights were then validated by primary participants.
Based on additional insights from these primary participants, more directional efforts were put into doing secondary research and optimize data models. This process was repeated till all data models used in the study produced similar results (with minimum deviation). This way, this iterative process was able to generate the most accurate market numbers and qualitative insights.
Secondary research
The secondary research sources that are typically mentioned to include, but are not limited to:
The paid sources for secondary research like Factiva, OneSource, Hoovers, and Statista
Primary Research:
Primary research involves telephonic interviews, e-mail interactions, as well as face-to-face interviews for each market, category, segment, and subsegment across geographies
The contributors who typically take part in such a course include, but are not limited to:
Data Modeling and Analysis:
In the iterative process (mentioned above), data models received inputs from primary as well as secondary sources. But analysts working on these models were the key. They used their extensive knowledge and experience about industry and topic to make changes and fine-tuning these models as per the product/service under study.
The standard data models used while studying this market were the top-down and bottom-up approaches and the company shares analysis model. However, other methods were also used along with these – which were specific to the industry and product/service under study.
To know more about the research methodology used for this study, kindly contact us/click here.