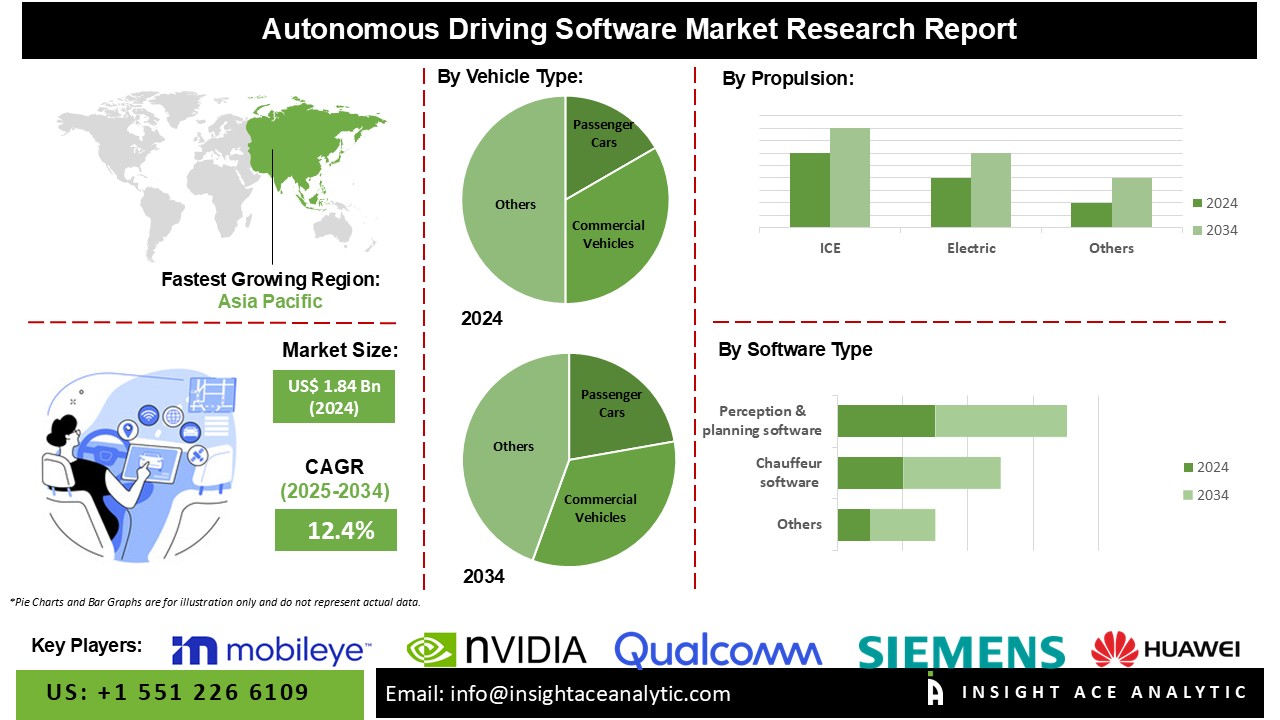
Autonomous Driving Software Market Size is valued at USD 1.84 Bn in 2024 and is predicted to reach USD 5.81 Bn by the year 2034 at an 12.4% CAGR during the forecast period for 2025-2034.

The market for autonomous driving software is expanding due in large part to the growing need for safer and more effective transportation options. Automotive manufacturers are obligated to integrate safety features into their vehicles due to the worldwide enforcement of strict safety regulations. Self-driving cars, including trucks and other vehicles, are designed to operate safely without the need for a driver to take control. While designs may vary, most self-driving systems rely on a combination of sensors, such as radar, to create and maintain a detailed map of their environment.
The software processes these inputs to generate a driving path and sends commands to the vehicle’s actuators, which control steering, braking, and acceleration. To ensure safe operation, the software utilizes hard-coded rules, predictive modeling, obstacle avoidance algorithms, and intelligent object discrimination to navigate traffic laws and avoid obstacles effectively. The autopilot driving software is instantly modified by this change because it helps to comply with specific safety requirements. To ensure vehicle safety, it makes use of complex algorithms and real-time data processing.
Furthermore, because autonomous driving technologies can be seamlessly included into the electronic structures of electric vehicles, the increasing popularity of EVs supports the advancement of these technologies. Simultaneously to this, the rigorous development of advanced driver assistance system (ADAS) technology sets even greater standards for sophisticated software applications utilized by the automotive sector. Among the several automation and safety features that are part of ADAS are adaptive cruise control and lane-keeping assistance. Constant advancements in sensor fusion, AI, and machine learning (ML) technologies are driving the industry.
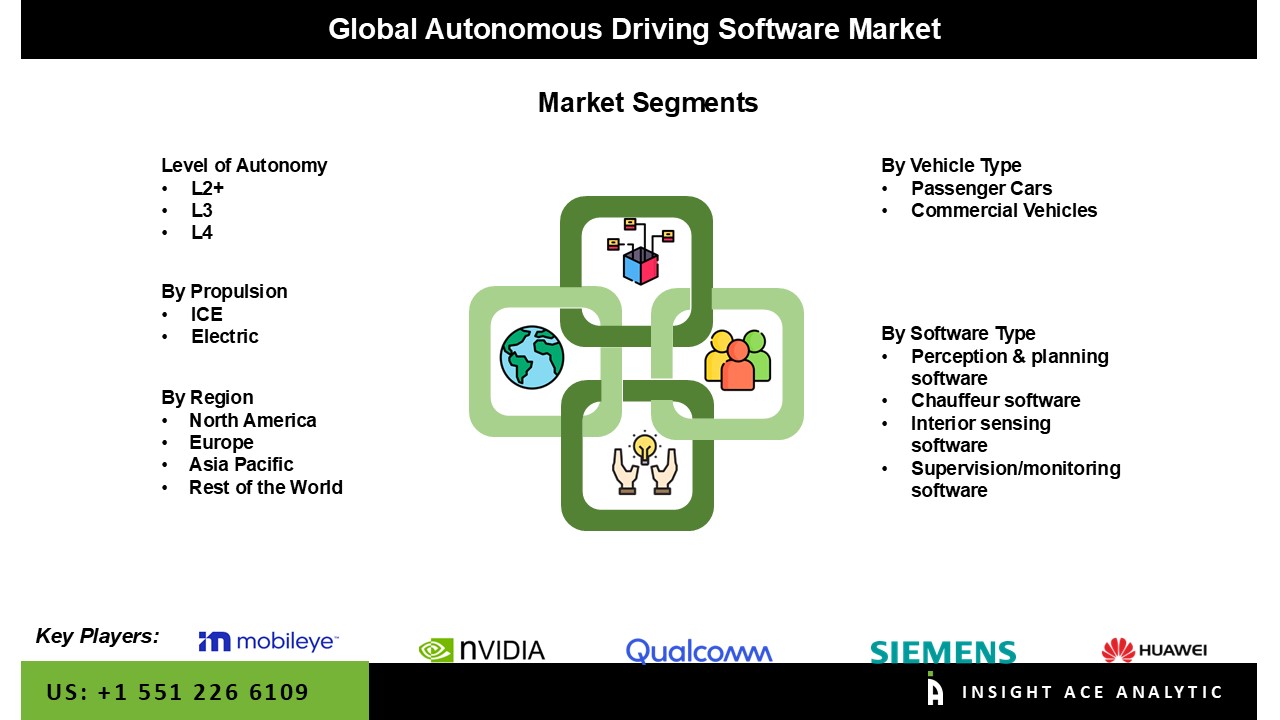
The Autonomous Driving Software Market is segmented based level of autonomy, vehicle type, propulsion, software type. Based on the Level of Autonomy, the market segmented into L2+, L3, L4. Based on the vehicle type, the market segmented into passenger cars, commercial vehicles. Based on Propulsion, the market segmented into, ICE, electric. Based on software type, the market segmented into perception & planning software, chauffeur software, interior sensing software, supervision/monitoring software.
Based on the level of autonomy, the market segmented into L2+, L3, L4. Among these, the L2+ solutions segment is expected to have the highest growth rate during the forecast period. This level represents partial automation, where the vehicle can control steering, acceleration, and braking in certain conditions, but the driver must be engaged and ready to take over. L2+ autonomous vehicles offer advanced driver assistance features like lane departure warning, adaptive cruise control, blind spot detection, automated emergency braking, and lane-keeping assistance. The "plus" indicates systems that offer more advanced features, such as automated lane changes or advanced cruise control. L2+ is a rapidly growing segment as it balances automation with driver control.
Based on the vehicle type, the market segmented into Passenger Cars, commercial vehicles. Among these, the passenger cars models segment dominates the market. This dominance is driven by the high adoption rate of advanced driver assistance systems (ADAS) and autonomous features in passenger vehicles. Major automotive OEMs are focusing heavily on integrating autonomous technologies into passenger cars, catering to the growing consumer demand for enhanced safety, convenience, and driving experience.
The region controls the majority of the global market because of the rising use of these cars and consumer desire for features with cutting-edge technologies. Automakers intend to extend their production networks and achieve technological advancements in developing nations like China and India. The Asia Pacific region is home to leading technology companies, automotive manufacturers, and startups that are heavily investing in autonomous driving technologies. Strong R&D capabilities, coupled with partnerships between tech firms and automakers, drive innovation and market growth.
| Report Attribute | Specifications |
| Market Size Value In 2023 | USD 1.84 Bn |
| Revenue Forecast In 2031 | USD 5.81 Bn |
| Growth Rate CAGR | CAGR of 12.4% from 2025 to 2034 |
| Quantitative Units | Representation of revenue in US$ Bn and CAGR from 2025 to 2034 |
| Historic Year | 2021 to 2024 |
| Forecast Year | 2025-2034 |
| Report Coverage | The forecast of revenue, the position of the company, the competitive market structure, growth prospects, and trends |
| Segments Covered | Level of Autonomy, Vehicle Type, Propulsion, Software Type |
| Regional Scope | North America; Europe; Asia Pacific; Latin America; Middle East & Africa |
| Country Scope | U.S.; Canada; U.K.; Germany; China; India; Japan; Brazil; Mexico; France; Italy; Spain; South Korea; South East Asia |
| Competitive Landscape | Autox, Cruise, Carmera, Embark Trucks, Magna International, Motional, Nauto, Mobileye, Nvidia Corporation, Tesla Inc, Siemens Ag, Qualcomm, Huawei, Aurora Innovation Ltd., Aptiv, Waymo Green Hills, Blackberry, Astemo, Cariad, Baidu, Continental Ag, Robert Bosch, Woven (By Toyota), AI Motive, Pony AI, Kpit, Oxa Autonomy Limited, Zoox, Inc., Imagry, Wayve Technologies Ltd. |
| Customization Scope | Free customization report with the procurement of the report and modifications to the regional and segment scope. Particular Geographic competitive landscape. |
| Pricing and Available Payment Methods | Explore pricing alternatives that are customized to your particular study requirements. |
Global Autonomous Driving Software Market - Level of Autonomy

Global Autonomous Driving Software Market – By Vehicle Type
Global Autonomous Driving Software Market – Based on Propulsion
Global Autonomous Driving Software Market – By Software Type
Global Autonomous Driving Software Market – By Region
North America-
Europe-
Asia-Pacific-
Latin America-
Middle East & Africa-
This study employed a multi-step, mixed-method research approach that integrates:
This approach ensures a balanced and validated understanding of both macro- and micro-level market factors influencing the market.
Secondary research for this study involved the collection, review, and analysis of publicly available and paid data sources to build the initial fact base, understand historical market behaviour, identify data gaps, and refine the hypotheses for primary research.
Secondary data for the market study was gathered from multiple credible sources, including:
These sources were used to compile historical data, market volumes/prices, industry trends, technological developments, and competitive insights.

Primary research was conducted to validate secondary data, understand real-time market dynamics, capture price points and adoption trends, and verify the assumptions used in the market modelling.
Primary interviews for this study involved:
Interviews were conducted via:
Primary insights were incorporated into demand modelling, pricing analysis, technology evaluation, and market share estimation.
All collected data were processed and normalized to ensure consistency and comparability across regions and time frames.
The data validation process included:
This ensured that the dataset used for modelling was clean, robust, and reliable.
The bottom-up approach involved aggregating segment-level data, such as:
This method was primarily used when detailed micro-level market data were available.

The top-down approach used macro-level indicators:
This approach was used for segments where granular data were limited or inconsistent.
To ensure accuracy, a triangulated hybrid model was used. This included:
This multi-angle validation yielded the final market size.
Market forecasts were developed using a combination of time-series modelling, adoption curve analysis, and driver-based forecasting tools.
Given inherent uncertainties, three scenarios were constructed:
Sensitivity testing was conducted on key variables, including pricing, demand elasticity, and regional adoption.