
Threat Hunting Market Size is valued at USD 3.1 billion in 2023 and is predicted to reach USD 8.5 billion by the year 2031 at a 13.7% CAGR during the forecast period for 2024-2031.

Threat hunting is the process by which professionals actively search a network for indicators of criminal activity or security vulnerabilities. Unlike reactive responses, it entails personally spotting and reducing such hazards before they become damaging. The growing complexity of cyberattacks, marked by advanced and relentless threats, is driving companies to implement proactive threat-hunting techniques. Continuous monitoring and better detection are crucial because conventional security measures usually fail against these changing hazards. Strong regulatory compliance rules for data security and protection also force businesses to apply thorough threat-hunting techniques to protect private information.
Moreover, growing knowledge of cybersecurity threats motivates companies to invest in proactive threat management, especially as digital transformation quickens. The broad acceptance of IoT devices and cloud services will raise the attack surface and the demand for a threat-hunting market in the coming years.
However, the high cost of developing a threat-hunting sector is a significant market constraint. A need for more expertise and rising security issues further hinders market growth. The COVID-19 epidemic sped up the threat-hunting market as remote work raised cyber dangers. Cyberattacks surged through companies, which created a greater need for proactive threat hunting. In addition, there is rising acceptance of IoT devices and cloud services, rising government incentives, and more investment in the hunting market.
The threat-hunting market is segmented based on offering, threat type, deployment mode, verticals and organization size. Based on the offering, the market is segmented into tools and services. The market is segmented by threat type into advanced persistent threats (APTs), malware and ransomware, insider threats, phishing and social engineering, and others. The deployment mode segment is again segmented into cloud and on-premises. The market is segmented by organisation size into large enterprises, and SMEs. According to the verticals segment, the market comprises BFSI, IT and ITeS, government, energy and utilities, manufacturing, healthcare, retail, and others.
Services are expected to dominate the threat-hunting market in 2023. The increasing reliance on expert-managed services for proactive threat detection, due to the scarcity of qualified cybersecurity experts and the need for cutting-edge resources, is a major driver of this trend. Businesses are turning to specialist service providers for constant monitoring and quick response to the growing cyber threats, further boosting the market growth.
The BFSI segment is witnessing rapid growth in the threat-hunting market. This is largely due to the sector's vulnerability to advanced cyberattacks, given the sensitivity of financial data. To proactively detect and mitigate these threats, BFSI firms are increasingly adopting threat-hunting solutions. This trend is further fueled by regulatory requirements for increased security measures and the need to secure consumer information and financial assets, particularly in countries like the US, Germany, the UK, China, and India.
The North American threat-hunting market is expected to report the largest market revenue share shortly. This can be attributed to the region's emphasis on cybersecurity, its strong technological infrastructure, the high frequency of complex cyberattacks, and the many cybersecurity-focused firms there. In addition, Asia Pacific is projected to grow rapidly in the threat-hunting market because of increasing government initiatives to fortify digital defences, stringent data protection regulations, and a growing awareness of cybersecurity risks, contributing to the market's expansion in Asia-Pacific.
|
Report Attribute |
Specifications |
|
Market Size Value In 2023 |
USD 3.1 Bn |
|
Revenue Forecast In 2031 |
USD 8.5 Bn |
|
Growth Rate CAGR |
CAGR of 13.7% from 2024 to 2031 |
|
Quantitative Units |
Representation of revenue in US$ Bn and CAGR from 2024 to 2031 |
|
Historic Year |
2019 to 2023 |
|
Forecast Year |
2024-2031 |
|
Report Coverage |
The forecast of revenue, the position of the company, the competitive market structure, growth prospects, and trends |
|
Segments Covered |
By Offering, Threat Type, Deployment Mode, Organization Size and By Vertical |
|
Regional Scope |
North America; Europe; Asia Pacific; Latin America; Middle East & Africa |
|
Country Scope |
U.S.; Canada; U.K.; Germany; China; India; Japan; Brazil; Mexico; France; Italy; Spain; South East Asia; South Korea |
|
Competitive Landscape |
IBM, Kaspersky, Capgemin, CrowdStrik, Trustwave, Verizon, SecureWork, Sangfor, Evide, Rapid 7, VMware, Solidworks, Trend Micro, Cynet, and Palo Alto Networks. And Other Market Players |
|
Customization Scope |
Free customization report with the procurement of the report and modifications to the regional and segment scope. Particular Geographic competitive landscape. |
|
Pricing And Available Payment Methods |
Explore pricing alternatives that are customized to your particular study requirements. |
Chapter 1. Methodology and Scope
1.1. Research Methodology
1.2. Research Scope & Assumptions
Chapter 2. Executive Summary
Chapter 3. Global Threat Hunting Market Snapshot
Chapter 4. Global Threat Hunting Market Variables, Trends & Scope
4.1. Market Segmentation & Scope
4.2. Drivers
4.3. Challenges
4.4. Trends
4.5. Investment and Funding Analysis
4.6. Porter's Five Forces Analysis
4.7. Incremental Opportunity Analysis (US$ MN), 2024-2031
4.8. Global Threat Hunting Market Penetration & Growth Prospect Mapping (US$ Mn), 2023-2031
4.9. Competitive Landscape & Market Share Analysis, By Key Player (2023)
4.10. Use/impact of AI on Threat Hunting Industry Trends
Chapter 5. Threat Hunting Market Segmentation 1: By Threat Type, Estimates & Trend Analysis
5.1. Market Share by Threat Type, 2023 & 2031
5.2. Market Size (Value US$ Mn) & Forecasts and Trend Analyses, 2019 to 2031 for the following Threat Type:
5.2.1. Advanced Persistent Threats (APTs)
5.2.2. Malware and Ransomware
5.2.3. Insider Threats
5.2.4. Phishing and Social Engineering
5.2.5. Others
Chapter 6. Threat Hunting Market Segmentation 2: By Deployment Mode, Estimates & Trend Analysis
6.1. Market Share by Deployment Mode, 2023 & 2031
6.2. Market Size (Value US$ Mn) & Forecasts and Trend Analyses, 2019 to 2031 for the following Deployment Modes:
6.2.1. Cloud
6.2.2. On-Premises
Chapter 7. Threat Hunting Market Segmentation 3: By Organization Size, Estimates & Trend Analysis
7.1. Market Share by Organization Size, 2023 & 2031
7.2. Market Size (Value US$ Mn) & Forecasts and Trend Analyses, 2019 to 2031 for the following Organization Sizes:
7.2.1. Preclinical Large Enterprises
7.2.2. SMEs
7.2.3. Vertical
7.2.4. BFSI
7.2.5. IT and ITeS
7.2.6. Government
7.2.7. Energy and Utilities
7.2.8. Manufacturing
7.2.9. Healthcare
7.2.10. Retail
7.2.11. Others Verticals
Chapter 8. Threat Hunting Market Segmentation 4: By Offering, Estimates & Trend Analysis
8.1. Market Share by Offering, 2023 & 2031
8.2. Market Size (Value US$ Mn) & Forecasts and Trend Analyses, 2019 to 2031 for the following Offerings:
8.2.1. Tools
8.2.1.1. EDR
8.2.1.2. SEIM
8.2.1.3. NDR
8.2.1.4. Threat Intelligence platform
8.2.1.5. Others
8.2.2. Services
8.2.2.1. Professional Services
8.2.2.2. Managed Services
Chapter 9. Threat Hunting Market Segmentation 5: Regional Estimates & Trend Analysis
9.1. Global Threat Hunting Market, Regional Snapshot 2023 & 2031
9.2. North America
9.2.1. North America Threat Hunting Market Revenue (US$ Million) Estimates and Forecasts by Country, 2019-2031
9.2.1.1. US
9.2.1.2. Canada
9.2.2. North America Threat Hunting Market Revenue (US$ Million) Estimates and Forecasts by Threat Type, 2019-2031
9.2.3. North America Threat Hunting Market Revenue (US$ Million) Estimates and Forecasts by Deployment Mode, 2019-2031
9.2.4. North America Threat Hunting Market Revenue (US$ Million) Estimates and Forecasts by Organization Size, 2019-2031
9.2.5. North America Threat Hunting Market Revenue (US$ Million) Estimates and Forecasts by Offering, 2019-2031
9.3. Europe
9.3.1. Europe Threat Hunting Market Revenue (US$ Million) Estimates and Forecasts by Country, 2019-2031
9.3.1.1. Germany
9.3.1.2. U.K.
9.3.1.3. France
9.3.1.4. Italy
9.3.1.5. Spain
9.3.1.6. Rest of Europe
9.3.2. Europe Threat Hunting Market Revenue (US$ Million) Estimates and Forecasts by Threat Type, 2019-2031
9.3.3. Europe Threat Hunting Market Revenue (US$ Million) Estimates and Forecasts by Deployment Mode, 2019-2031
9.3.4. Europe Threat Hunting Market Revenue (US$ Million) Estimates and Forecasts by Organization Size, 2019-2031
9.3.5. Europe Threat Hunting Market Revenue (US$ Million) Estimates and Forecasts by Offering, 2019-2031
9.4. Asia Pacific
9.4.1. Asia Pacific Threat Hunting Market Revenue (US$ Million) Estimates and Forecasts by Country, 2019-2031
9.4.1.1. India
9.4.1.2. China
9.4.1.3. Japan
9.4.1.4. Australia
9.4.1.5. South Korea
9.4.1.6. Hong Kong
9.4.1.7. Southeast Asia
9.4.1.8. Rest of Asia Pacific
9.4.2. Asia Pacific Threat Hunting Market Revenue (US$ Million) Estimates and Forecasts by Threat Type, 2019-2031
9.4.3. Asia Pacific Threat Hunting Market Revenue (US$ Million) Estimates and Forecasts by Deployment Mode, 2019-2031
9.4.4. Asia Pacific Threat Hunting Market Revenue (US$ Million) Estimates and Forecasts By Organization Size, 2019-2031
9.4.5. Asia Pacific Threat Hunting Market Revenue (US$ Million) Estimates and Forecasts by Offering, 2019-2031
9.5. Latin America
9.5.1. Latin America Threat Hunting Market Revenue (US$ Million) Estimates and Forecasts by Country, 2019-2031
9.5.1.1. Brazil
9.5.1.2. Mexico
9.5.1.3. Rest of Latin America
9.5.2. Latin America Threat Hunting Market Revenue (US$ Million) Estimates and Forecasts by Threat Type, 2019-2031
9.5.3. Latin America Threat Hunting Market Revenue (US$ Million) Estimates and Forecasts by Deployment Mode, 2019-2031
9.5.4. Latin America Threat Hunting Market Revenue (US$ Million) Estimates and Forecasts by Organization Size, 2019-2031
9.5.5. Latin America Threat Hunting Market Revenue (US$ Million) Estimates and Forecasts by Offering, 2019-2031
9.6. Middle East & Africa
9.6.1. Middle East & Africa Threat Hunting Market Revenue (US$ Million) Estimates and Forecasts by country, 2019-2031
9.6.1.1. GCC Countries
9.6.1.2. Israel
9.6.1.3. South Africa
9.6.1.4. Rest of Middle East and Africa
9.6.2. Middle East & Africa Threat Hunting Market Revenue (US$ Million) Estimates and Forecasts by Threat Type, 2019-2031
9.6.3. Middle East & Africa Threat Hunting Market Revenue (US$ Million) Estimates and Forecasts by application, 2019-2031
9.6.4. Middle East & Africa Threat Hunting Market Revenue (US$ Million) Estimates and Forecasts by Organization Size, 2019-2031
9.6.5. Middle East & Africa Threat Hunting Market Revenue (US$ Million) Estimates and Forecasts by Offering, 2019-2031
Chapter 10. Competitive Landscape
10.1. Major Mergers and Acquisitions/Strategic Alliances
10.2. Company Profiles
10.2.1. KASPERSKY
10.2.1.1. Business Overview
10.2.1.2. Key Product/Service Offerings
10.2.1.3. Financial Performance
10.2.1.4. Geographical Presence
10.2.1.5. Recent Developments with Business Strategy
10.2.2. IBM
10.2.3. Capgemini
10.2.4. CrowdStrike
10.2.5. Trustwave
10.2.6. Verizon
10.2.7. SecureWorks
10.2.8. Sangfor
10.2.9. Eviden
10.2.10. Rapid 7
10.2.11. VMware
10.2.12. Solidworks
10.2.13. Trend Micro
10.2.14. Cynet
10.2.15. Palo Alto Networks
10.2.16. Cipher
10.2.17. Talatek
10.2.18. SOC Prime
10.2.19. RSI Security
10.2.20. Protected Harbour
10.2.21. Mindpoint Group
10.2.22. Exponential- E
10.2.23. Redscan
10.2.24. Iron Net Cybersecurity
10.2.25. LiveAction
10.2.26. Other Market Players
Threat-Hunting Market By Offering-

Threat-Hunting Market By Threat Type-
Threat-Hunting Market By Deployment Mode-
Threat-Hunting Market By Organization Size-
Threat-Hunting Market By Vertical
Threat-Hunting Market By Region-
North America-
Europe-
Asia-Pacific-
Latin America-
Middle East & Africa-
InsightAce Analytic follows a standard and comprehensive market research methodology focused on offering the most accurate and precise market insights. The methods followed for all our market research studies include three significant steps – primary research, secondary research, and data modeling and analysis - to derive the current market size and forecast it over the forecast period. In this study, these three steps were used iteratively to generate valid data points (minimum deviation), which were cross-validated through multiple approaches mentioned below in the data modeling section.
Through secondary research methods, information on the market under study, its peer, and the parent market was collected. This information was then entered into data models. The resulted data points and insights were then validated by primary participants.
Based on additional insights from these primary participants, more directional efforts were put into doing secondary research and optimize data models. This process was repeated till all data models used in the study produced similar results (with minimum deviation). This way, this iterative process was able to generate the most accurate market numbers and qualitative insights.
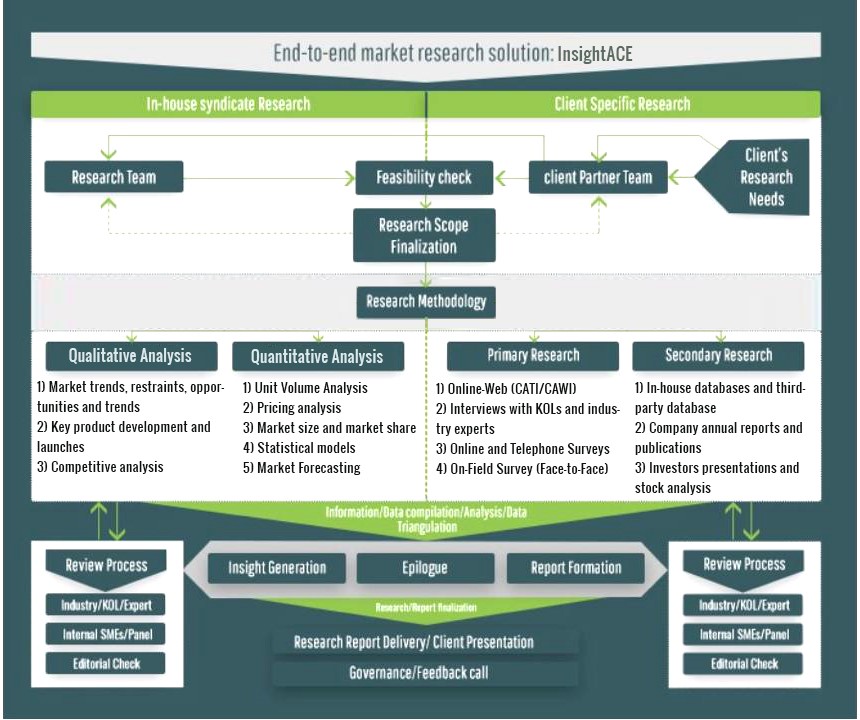
Secondary research
The secondary research sources that are typically mentioned to include, but are not limited to:
The paid sources for secondary research like Factiva, OneSource, Hoovers, and Statista
Primary Research:
Primary research involves telephonic interviews, e-mail interactions, as well as face-to-face interviews for each market, category, segment, and subsegment across geographies
The contributors who typically take part in such a course include, but are not limited to:
Data Modeling and Analysis:
In the iterative process (mentioned above), data models received inputs from primary as well as secondary sources. But analysts working on these models were the key. They used their extensive knowledge and experience about industry and topic to make changes and fine-tuning these models as per the product/service under study.
The standard data models used while studying this market were the top-down and bottom-up approaches and the company shares analysis model. However, other methods were also used along with these – which were specific to the industry and product/service under study.
