
Global Electromyography Devices Market Size valued at USD 942.5 Mn in 2024 and is predicted to USD 1730.3 Mn by the year 2034 at a 6.4% CAGR during the forecast period for 2025-2034.
Key Industry Insights & Findings from the Report:

Skeletal muscle electrical activity is measured and recorded during a test called electromyography (EMG), also known as neuromuscular electrical signals or electromyograms. Small needle electrodes are inserted into the appropriate muscles during the procedure and connected to an amplifier afterwards. These muscular movements may be seen, heard, and heard through speakers, images projected on a screen monitor, or printed out in real-time using computer software if they can be recorded using electrodes positioned on the skin surface above them.
Electromyography (EMG) can identify electrical activity or muscle response by analyzing how the muscles react to muscle stimulation. The diagnosis process is aided by the ability of EMG to identify neuromuscular anomalies.
The Electromyography Devices market is segmented on the basis of product mobility, study type, product and application. Based on product mobility, the market is segmented as stationary EMG systems and portable EMG Systems. The study type segment includes nerve conduction and evoked potential. By product, the market is segmented into EMG Type (Surface EMG and Intramuscular EMG), software, electrode, and other products. On the basis of applications, segments include muscular disorders, neuro disorders, neuromuscular disorders, and other applications.
Hospitals and clinics employ stationary-type EMG devices. To ensure that the electrodes stay in touch with the skin during portable testing, stationary EMGs measure the electrical activity from a muscle or group of muscles without shifting them to a different location. This stationary-type device is appropriate for patients who do not have any movement disorders or muscular weakness because of its lightweight design, ease of mobility, and straightforward operation.
When compared with stationary types, portable types are easily carried and ready for use right away. These devices are compact, making it easy for users to have them in their pockets or bags for patient convenience at any time. It assists in conducting clinical tests without the need for assistance and is simple for both patients and medical professionals to use.
According to estimates, North America has the largest market share for portable electromyography equipment, and it is projected that it will resume holding this position for a few more decades due to the region's high level of electromyography awareness and increased incidence of neurological and muscular illnesses. Favourable government programmes and policies about the development of the healthcare system also assist a substantial chunk of this area. In the United States, the usage of these devices for diagnosing neuromuscular illnesses has grown due to favourable payment regulations.
|
Report Attribute |
Specifications |
|
Market Size Value In 2024 |
USD 942.5 Mn |
|
Revenue Forecast In 2034 |
USD 1730.3 Mn |
|
Growth rate CAGR |
CAGR of 6.4% from 2025 to 2034 |
|
Quantitative units |
Representation of revenue in US$ Billion, volume (units) and CAGR from 2025 to 2034 |
|
Historic Year |
2021 to 2024 |
|
Forecast Year |
2025-2034 |
|
Report coverage |
The forecast of revenue, the position of the company, the competitive market statistics, growth prospects, and trends |
|
Segments covered |
Product Mobility, Study Type, Product And Application |
|
Regional scope |
North America; Europe; Asia Pacific; Latin America; Middle East & Africa |
|
Country scope |
U.S.; Canada; U.K.; Germany; China; India; Japan; Brazil; Mexico; The UK; France; Italy; Spain; China; Japan; India; South Korea; Southeast Asia; South Korea; Southeast Asia |
|
Competitive Landscape |
ADInstruments, A-M Systems LLC, Ambu AS, Biometrics Ltd., Cometa Srl., Delsys Incorporated, Dexur, iWorx, Natus Medical Incorporated, and Neurosoft. |
|
Customization scope |
Free customization report with the procurement of the report, Modifications to the regional and segment scope. Particular Geographic competitive landscape. |
|
Pricing and available payment methods |
Explore pricing alternatives that are customized to your particular study requirements. |
Chapter 1. Methodology and Scope
1.1. Research Methodology
1.2. Research Scope & Assumptions
Chapter 2. Executive Summary
Chapter 3. Global Electromyography Devices Market Snapshot
Chapter 4. Global Electromyography Devices Market Variables, Trends & Scope
4.1. Market Segmentation & Scope
4.2. Drivers
4.3. Challenges
4.4. Trends
4.5. Investment and Funding Analysis
4.6. Industry Analysis – Porter’s Five Forces Analysis
4.7. Competitive Landscape & Market Share Analysis
4.8. Impact of Covid-19 Analysis
Chapter 5. Market Segmentation 1: by Product Mobility Estimates & Trend Analysis
5.1. by Product Mobility & Market Share, 2024 & 2034
5.2. Market Size (Value (US$ Mn)) & Forecasts and Trend Analyses, 2021 to 2034 for the following by Product Mobility:
5.2.1. Stationary EMG Systems
5.2.2. Portable EMG Systems
Chapter 6. Market Segmentation 2: by Study Type Estimates & Trend Analysis
6.1. by Study Type & Market Share, 2024 & 2034
6.2. Market Size (Value (US$ Mn)) & Forecasts and Trend Analyses, 2021 to 2034 for the following by Study Type:
6.2.1. Nerve Conduction
6.2.2. Evoked Potential
Chapter 7. Market Segmentation 3: by Product Estimates & Trend Analysis
7.1. by Product & Market Share, 2024 & 2034
7.2. Market Size (Value (US$ Mn)) & Forecasts and Trend Analyses, 2021 to 2034 for the following by Product:
7.2.1. EMG Type
7.2.1.1. Surface EMG
7.2.1.2. Intramuscular EMG
7.2.2. Software
7.2.3. Electrode
7.2.4. Other Products
Chapter 8. Market Segmentation 4: by Application Estimates & Trend Analysis
8.1. by Application & Market Share, 2024 & 2034
8.2. Market Size (Value (US$ Mn)) & Forecasts and Trend Analyses, 2021 to 2034 for the following by Application:
8.2.1. Muscular Disorders
8.2.2. Neuro Disorders
8.2.3. Neuromuscular disorders
8.2.4. Other Applications
Chapter 9. Electromyography Devices Market Segmentation 5: Regional Estimates & Trend Analysis
9.1. North America
9.1.1. North America Electromyography Devices Market Revenue (US$ Million) Estimates and Forecasts by Product Mobility, 2021-2034
9.1.2. North America Electromyography Devices Market Revenue (US$ Million) Estimates and Forecasts by Study Type, 2021-2034
9.1.3. North America Electromyography Devices Market Revenue (US$ Million) Estimates and Forecasts by Product, 2021-2034
9.1.4. North America Electromyography Devices Market Revenue (US$ Million) Estimates and Forecasts by Application, 2021-2034
9.1.5. North America Electromyography Devices Market Revenue (US$ Million) Estimates and Forecasts by country, 2021-2034
9.2. Europe
9.2.1. Europe Electromyography Devices Market Revenue (US$ Million) Estimates and Forecasts by Product Mobility, 2021-2034
9.2.2. Europe Electromyography Devices Market Revenue (US$ Million) Estimates and Forecasts by Study Type, 2021-2034
9.2.3. Europe Electromyography Devices Market Revenue (US$ Million) Estimates and Forecasts by Product, 2021-2034
9.2.4. Europe Electromyography Devices Market Revenue (US$ Million) Estimates and Forecasts by Application, 2021-2034
9.2.5. Europe Electromyography Devices Market Revenue (US$ Million) Estimates and Forecasts by country, 2021-2034
9.3. Asia Pacific
9.3.1. Asia Pacific Electromyography Devices Market Revenue (US$ Million) Estimates and Forecasts by Product Mobility, 2021-2034
9.3.2. Asia Pacific Electromyography Devices Market Revenue (US$ Million) Estimates and Forecasts by Study Type, 2021-2034
9.3.3. Asia-Pacific Electromyography Devices Market Revenue (US$ Million) Estimates and Forecasts by Product, 2021-2034
9.3.4. Asia-Pacific Electromyography Devices Market Revenue (US$ Million) Estimates and Forecasts by Application, 2021-2034
9.3.5. Asia Pacific Electromyography Devices Market Revenue (US$ Million) Estimates and Forecasts by country, 2021-2034
9.4. Latin America
9.4.1. Latin America Electromyography Devices Market Revenue (US$ Million) Estimates and Forecasts by Product Mobility, 2021-2034
9.4.2. Latin America Electromyography Devices Market Revenue (US$ Million) Estimates and Forecasts by Study Type, 2021-2034
9.4.3. Latin America Electromyography Devices Market Revenue (US$ Million) Estimates and Forecasts by Product, 2021-2034
9.4.4. Latin America Electromyography Devices Market Revenue (US$ Million) Estimates and Forecasts by Application, 2021-2034
9.4.5. Latin America Electromyography Devices Market Revenue (US$ Million) Estimates and Forecasts by country, 2021-2034
9.5. Middle East & Africa
9.5.1. Middle East & Africa Electromyography Devices Market Revenue (US$ Million) Estimates and Forecasts by Product Mobility, 2021-2034
9.5.2. Middle East & Africa Electromyography Devices Market Revenue (US$ Million) Estimates and Forecasts by Study Type, 2021-2034
9.5.3. Middle East & Africa Electromyography Devices Market Revenue (US$ Million) Estimates and Forecasts by Product, 2021-2034
9.5.4. Middle East & Africa Electromyography Devices Market Revenue (US$ Million) Estimates and Forecasts by Application, 2021-2034
9.5.5. Middle East & Africa Electromyography Devices Market Revenue (US$ Million) Estimates and Forecasts by country, 2021-2034
Chapter 10. Competitive Landscape
10.1. Major Mergers and Acquisitions/Strategic Alliances
10.2. Company Profiles
10.2.1. ADInstruments
10.2.2. A-M Systems LLC.
10.2.3. Ambu AS
10.2.4. Biometrics Ltd.
10.2.5. Cometa Srl.
10.2.6. Delsys Incorporated
10.2.7. Dexur
10.2.8. iWorx
10.2.9. Natus Medical Incorporated
10.2.10. Neurosoft
10.2.11. Other Prominent Players
Electromyography Devices Market By Product Mobility-

Electromyography Devices Market By Study Type-
Electromyography Devices Market By Product-
Electromyography Devices Market By Application-
Electromyography Devices Market By Region-
North America-
Europe-
Asia-Pacific-
Latin America-
Middle East & Africa-
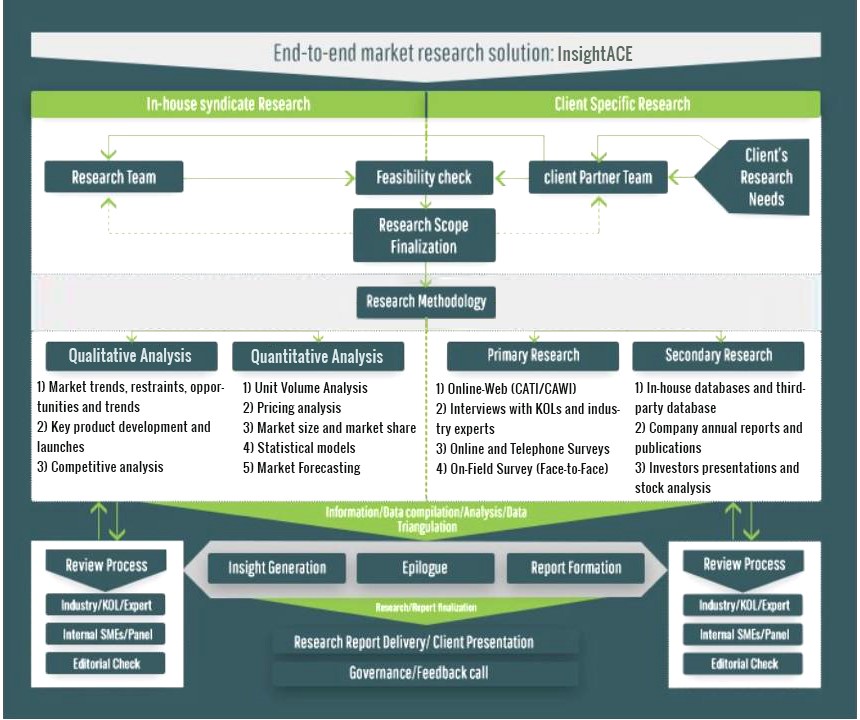
InsightAce Analytic follows a standard and comprehensive market research methodology focused on offering the most accurate and precise market insights. The methods followed for all our market research studies include three significant steps – primary research, secondary research, and data modeling and analysis - to derive the current market size and forecast it over the forecast period. In this study, these three steps were used iteratively to generate valid data points (minimum deviation), which were cross-validated through multiple approaches mentioned below in the data modeling section.
Through secondary research methods, information on the market under study, its peer, and the parent market was collected. This information was then entered into data models. The resulted data points and insights were then validated by primary participants.
Based on additional insights from these primary participants, more directional efforts were put into doing secondary research and optimize data models. This process was repeated till all data models used in the study produced similar results (with minimum deviation). This way, this iterative process was able to generate the most accurate market numbers and qualitative insights.
Secondary research
The secondary research sources that are typically mentioned to include, but are not limited to:
The paid sources for secondary research like Factiva, OneSource, Hoovers, and Statista
Primary Research:
Primary research involves telephonic interviews, e-mail interactions, as well as face-to-face interviews for each market, category, segment, and subsegment across geographies
The contributors who typically take part in such a course include, but are not limited to:
Data Modeling and Analysis:
In the iterative process (mentioned above), data models received inputs from primary as well as secondary sources. But analysts working on these models were the key. They used their extensive knowledge and experience about industry and topic to make changes and fine-tuning these models as per the product/service under study.
The standard data models used while studying this market were the top-down and bottom-up approaches and the company shares analysis model. However, other methods were also used along with these – which were specific to the industry and product/service under study.
To know more about the research methodology used for this study, kindly contact us/click here.
