
The Dried Blood Spot Collection Cards Market Size is valued at USD 377.9 million in 2023 and is predicted to reach USD 537.8 million by the year 2031 at a 4.7% CAGR during the forecast period for 2024-2031.

Dried Blood Spot (DBS) Collection Cards are specifically designed cards utilized for the collection and preservation of tiny blood samples for diagnostic tests and research purposes. Blood is commonly obtained through a finger puncture and then absorbed onto the card, where it subsequently dries and can be stored for future examination. The growing initiatives from government bodies, private-public partnerships, and collaborative efforts to enhance utilization and raise awareness about diagnostic products are poised to stimulate market demand in the upcoming years.
Additionally, this technology allows first responders to collect a simple finger-prick specimen sample at a crime scene, such as in cases involving drug-facilitated or sexual assault, eliminating the need to wait for subsequent collection at the hospital after the victim has been admitted. This not only saves significant time but also reduces additional effort. The increasing benefits and ongoing research in DBS testing for diagnostic purposes are expected to drive market growth in the forecast period. Moreover, the World Health Organization (WHO) recently endorsed DBS for diagnosing hepatitis B & C and HIV due to its advantages in blood collection and transport.
However, a key challenge hindering market growth is the contamination issues associated with DBS collection cards. There have been instances where the use of these cards led to problems such as cross-contamination and exposure of samples for pathologists and clinicians handling specimens.
The global market of dried blood spot collection cards is categorized on the basis of application card type and end users. The market is segmented by material type into Cotton & Cellulose, Fiber-based, and Others. Applications include Newborn Screening, Infectious Disease Testing, Therapeutic Drug Monitoring, Forensic Testing, CRO/Research and Other Applications. End users comprise Hospitals and Clinics, Diagnostic Laboratories, Research Institutes, and Others. Card types include Whatman 903, Ahlstrom 226, FTA, and Others.
The Whatman 903 segment took the lead in the market with a major share and is projected to exhibit the swiftest Compound Annual Growth Rate (CAGR) throughout the forecast period. Whatman paper, a specific filter paper extensively used in qualitative analysis, characterizes this segment. Among various paper types, the Whatman 903 filter paper stands out as an FDA-approved in vitro Class II medical device that is widely employed in newborn screening programs globally despite its relatively higher cost as a ready-to-use card. Additionally, they boast high wet strength, facilitating the efficient removal of significant impurities.
Newborn screening involves a series of laboratory tests conducted on newborn infants to identify specific genetic diseases. This testing is conducted using a blood sample obtained from a heel prick, typically when the baby is between two and three days old. The growing demand for newborn screening in developed countries is a significant driver of segment growth. For example, in countries like the United States, newborn screening is mandatory for a specified group of genetic disorders, though the exact list varies from state to state. These tests are focused on conditions where early detection is crucial for effective treatment or prevention of disease. Detecting these conditions early enables prompt initiation of various treatments and interventions during the newborn's critical early stages of life, potentially leading to improved health outcomes and the prevention of severe, irreversible disabilities.
The North American dried blood spot collection cards market is expected to report the maximum market share in terms of revenue in the near future.]The leading market position is primarily due to a multitude of manufacturers and established childcare facilities. Public organizations' guidelines on DBS procedures guarantee superior quality products, fostering increased trust among researchers and clinicians. This enhances overall market demand throughout North America. The Asia-Pacific market for dried blood spot collection cards is projected to experience the highest CAGR in the coming years. This growth can be attributed to the sizable population base in countries like China & India.
Additionally, rising awareness about newborn screening is anticipated to influence the Asia-Pacific market positively by 2030. Furthermore, the increasing adoption of advanced laboratory techniques, including DBS collection cards, for swift diagnosis and investigations is a major driver of market expansion. The introduction of innovative DBS collection cards also plays a important role in driving this growth.
|
Report Attribute |
Specifications |
|
Market Size Value In 2023 |
USD 377.9 Mn |
|
Revenue Forecast In 2031 |
USD 537.8 Mn |
|
Growth Rate CAGR |
CAGR of 4.7% from 2024 to 2031 |
|
Quantitative Units |
Representation of revenue in US$ Mn and CAGR from 2024 to 2031 |
|
Historic Year |
2019 to 2023 |
|
Forecast Year |
2024-2031 |
|
Report Coverage |
The forecast of revenue, the position of the company, the competitive market structure, growth prospects, and trends |
|
Segments Covered |
By Application, Card Type, And End-User |
|
Regional Scope |
North America; Europe; Asia Pacific; Latin America; Middle East & Africa |
|
Country Scope |
U.S.; Canada; U.K.; Germany; China; India; Japan; Brazil; Mexico; France; Italy; Spain; Southeast Asia; South Korea |
|
Competitive Landscape |
QIAGEN, PerkinElmer, Roche, Shimadzu Corporation, Ahlstrom-Munksjö, Pall Corporation, Eastern Business Forms, Inc, Archimed Life Science Gmbh, Centogene N.V. and others |
|
Customization Scope |
Free customization report with the procurement of the report and modifications to the regional and segment scope. Particular Geographic competitive landscape. |
|
Pricing And Available Payment Methods |
Explore pricing alternatives that are customized to your particular study requirements. |
Chapter 1. Methodology and Scope
1.1. Research Methodology
1.2. Research Scope & Assumptions
Chapter 2. Executive Summary
Chapter 3. Global Dried Blood Spot Collection Cards Market Snapshot
Chapter 4. Global Dried Blood Spot Collection Cards Market Variables, Trends & Scope
4.1. Market Segmentation & Scope
4.2. Drivers
4.3. Challenges
4.4. Trends
4.5. Investment and Funding Analysis
4.6. Industry Analysis – Porter’s Five Forces Analysis
4.7. Competitive Landscape & Market Share Analysis
4.8. Impact of Covid-19 Analysis
Chapter 5. Market Segmentation 1: Card Type Estimates & Trend Analysis
5.1. Card Type & Market Share, 2019 & 2031
5.2. Market Size (Value (US$ Mn)) & Forecasts and Trend Analyses, 2019 to 2031 for the following Card Type:
5.2.1. Whatman 903
5.2.2. Ahlstrom 226
5.2.3. FTA
5.2.4. Others
Chapter 6. Market Segmentation 2: by Application Estimates & Trend Analysis
6.1. by Application & Market Share, 2019 & 2031
6.2. Market Size (Value (US$ Mn)) & Forecasts and Trend Analyses, 2019 to 2031 for the following by Application:
6.2.1. New Born Screening (NBS)
6.2.2. Infectious Diseases Testing
6.2.3. Therapeutic Drug Monitoring
6.2.4. Forensics
6.2.5. CRO/Research
6.2.6. Other Applications
Chapter 7. Market Segmentation 3: by End-use Estimates & Trend Analysis
7.1. by End-use & Market Share, 2019 & 2031
7.2. Market Size (Value (US$ Mn)) & Forecasts and Trend Analyses, 2019 to 2031 for the following by End-use:
7.2.1. Hospitals & Clinics
7.2.2. Diagnostics centers
7.2.3. Others
Chapter 8. Dried Blood Spot Collection Cards Market Segmentation 4: Regional Estimates & Trend Analysis
8.1. North America
8.1.1. North America Dried Blood Spot Collection Cards Market Revenue (US$ Million) Estimates and Forecasts Card Type, 2024-2031
8.1.2. North America Dried Blood Spot Collection Cards Market Revenue (US$ Million) Estimates and Forecasts by Application, 2024-2031
8.1.3. North America Dried Blood Spot Collection Cards Market Revenue (US$ Million) Estimates and Forecasts by End-use, 2024-2031
8.1.4. North America Dried Blood Spot Collection Cards Market Revenue (US$ Million) Estimates and Forecasts by country, 2024-2031
8.2. Europe
8.2.1. Europe Dried Blood Spot Collection Cards Market Revenue (US$ Million) Estimates and Forecasts Card Type, 2024-2031
8.2.2. Europe Dried Blood Spot Collection Cards Market Revenue (US$ Million) Estimates and Forecasts by Application, 2024-2031
8.2.3. Europe Dried Blood Spot Collection Cards Market Revenue (US$ Million) Estimates and Forecasts by End-use, 2024-2031
8.2.4. Europe Dried Blood Spot Collection Cards Market Revenue (US$ Million) Estimates and Forecasts by country, 2024-2031
8.3. Asia Pacific
8.3.1. Asia Pacific Dried Blood Spot Collection Cards Market Revenue (US$ Million) Estimates and Forecasts Card Type, 2024-2031
8.3.2. Asia Pacific Dried Blood Spot Collection Cards Market Revenue (US$ Million) Estimates and Forecasts by Application, 2024-2031
8.3.3. Asia-Pacific Dried Blood Spot Collection Cards Market Revenue (US$ Million) Estimates and Forecasts by End-use, 2024-2031
8.3.4. Asia Pacific Dried Blood Spot Collection Cards Market Revenue (US$ Million) Estimates and Forecasts by country, 2024-2031
8.4. Latin America
8.4.1. Latin America Dried Blood Spot Collection Cards Market Revenue (US$ Million) Estimates and Forecasts Card Type, 2024-2031
8.4.2. Latin America Dried Blood Spot Collection Cards Market Revenue (US$ Million) Estimates and Forecasts by Application, 2024-2031
8.4.3. Latin America Dried Blood Spot Collection Cards Market Revenue (US$ Million) Estimates and Forecasts by End-use, 2024-2031
8.4.4. Latin America Dried Blood Spot Collection Cards Market Revenue (US$ Million) Estimates and Forecasts by country, 2024-2031
8.5. Middle East & Africa
8.5.1. Middle East & Africa Dried Blood Spot Collection Cards Market Revenue (US$ Million) Estimates and Forecasts Card Type, 2024-2031
8.5.2. Middle East & Africa Dried Blood Spot Collection Cards Market Revenue (US$ Million) Estimates and Forecasts by Application, 2024-2031
8.5.3. Middle East & Africa Dried Blood Spot Collection Cards Market Revenue (US$ Million) Estimates and Forecasts by End-use, 2024-2031
8.5.4. Middle East & Africa Dried Blood Spot Collection Cards Market Revenue (US$ Million) Estimates and Forecasts by country, 2024-2031
Chapter 9. Competitive Landscape
9.1. Major Mergers and Acquisitions/Strategic Alliances
9.2. Company Profiles
9.2.1. QIAGEN
9.2.2. PerkinElmer
9.2.3. Roche
9.2.4. Shimadzu Corporation
9.2.5. Ahlstrom-Munksjö
9.2.6. Pall Corporation
9.2.7. Eastern Business Forms, Inc
9.2.8. Archimed Life Science Gmbh
9.2.9. Centogene N.V.
Dried Blood Spot Collection Cards Market By Application:

Dried Blood Spot Collection Cards Market By End User:
Dried Blood Spot Collection Cards Market By Card Type
Dried Blood Spot Collection Cards Market By Region-
North America-
Europe-
Asia-Pacific-
Latin America-
Middle East & Africa-
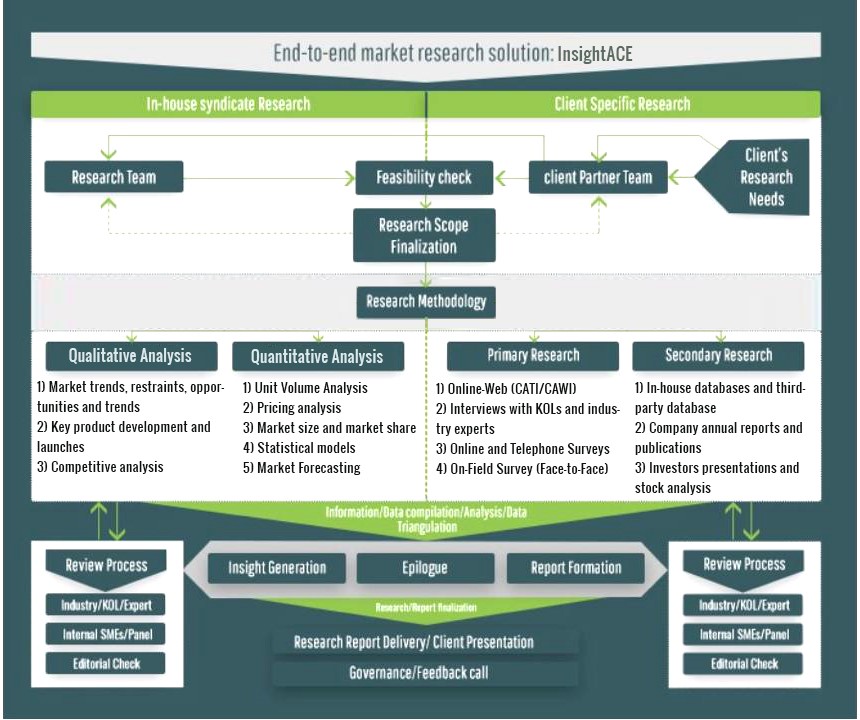
InsightAce Analytic follows a standard and comprehensive market research methodology focused on offering the most accurate and precise market insights. The methods followed for all our market research studies include three significant steps – primary research, secondary research, and data modeling and analysis - to derive the current market size and forecast it over the forecast period. In this study, these three steps were used iteratively to generate valid data points (minimum deviation), which were cross-validated through multiple approaches mentioned below in the data modeling section.
Through secondary research methods, information on the market under study, its peer, and the parent market was collected. This information was then entered into data models. The resulted data points and insights were then validated by primary participants.
Based on additional insights from these primary participants, more directional efforts were put into doing secondary research and optimize data models. This process was repeated till all data models used in the study produced similar results (with minimum deviation). This way, this iterative process was able to generate the most accurate market numbers and qualitative insights.
Secondary research
The secondary research sources that are typically mentioned to include, but are not limited to:
The paid sources for secondary research like Factiva, OneSource, Hoovers, and Statista
Primary Research:
Primary research involves telephonic interviews, e-mail interactions, as well as face-to-face interviews for each market, category, segment, and subsegment across geographies
The contributors who typically take part in such a course include, but are not limited to:
Data Modeling and Analysis:
In the iterative process (mentioned above), data models received inputs from primary as well as secondary sources. But analysts working on these models were the key. They used their extensive knowledge and experience about industry and topic to make changes and fine-tuning these models as per the product/service under study.
The standard data models used while studying this market were the top-down and bottom-up approaches and the company shares analysis model. However, other methods were also used along with these – which were specific to the industry and product/service under study.
