logo image
search icon
Real Estate Tokenization Market

Real Estate Tokenization Market Size, Share & Trends Analysis Report, By Asset Type (Residential, Commercial, Industrial), By Token Type (Security Tokens, Utility Tokens), By End-User (Investors, Developers, By Region, Forecasts, 2024-2031

Report ID : 2782 | Published : 2024-09-23 | Pages: 172 | Format: PDF/EXCEL

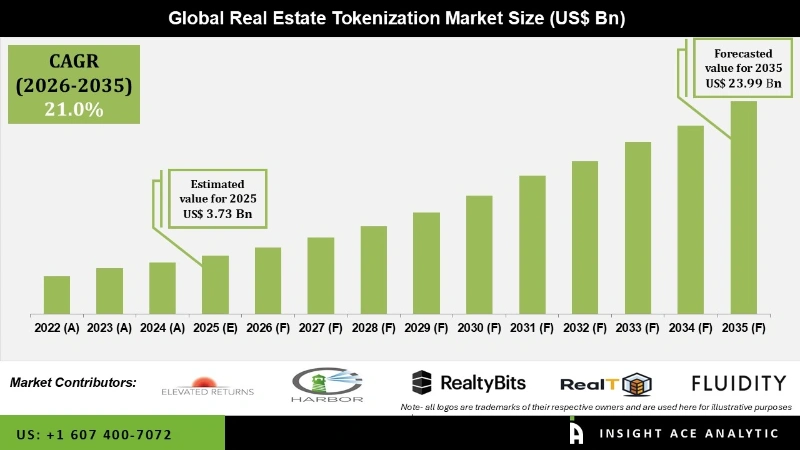
The Real Estate Tokenization Market Size was valued at USD 2.81 Bn in 2023 and is predicted to reach USD 11.80 Bn by 2031 at a 19.9% CAGR during the forecast period for 2024-2031.

real estate

Real estate tokenization means turning owning rights in a portion of real estate into digital tokens that can be used on a blockchain. The real estate tokenization market is growing because tokenization strategies are being actively explored and implemented by technology companies and real estate enterprises, driving the market's growth and development. Additionally, the immutable ledger that blockchain technology provides promotes transparency and decreases the likelihood of fraud, thereby providing investors with transaction records that are trustworthy and safe. Tokenization makes it possible to have fractional ownership, enabling more investors to capitalize on real estate opportunities with lower initial investment needs. Additionally, real estate tokenization solutions are developed in collaboration with blockchain platforms, legal advisers, developers, and companies in the industry. These solutions are secure and compliant and increase market liquidity, accessibility, and investment opportunities for all types of investors. The ongoing development of novel and improved real estate tokenization propels market expansion.

However, the real estate tokenization industry is expected to slow down market growth due to the lack of clarity about regulations, difficulties with technology, investors' lack of knowledge, and insufficient infrastructure. Moreover, the increased demand for liquidity, the spotlight on digital solutions, and the necessity for investors to seek out varied, robust assets through creative investment avenues, COVID-19, hastened the real estate tokenization market. Furthermore, the demand for real estate tokenization is expected to rise due to offering new investment opportunities based on blockchain technology to attract various investors and facilitate portfolio diversification.

Competitive Landscape

Some of the Major Key Players in the Real Estate Tokenization Market are

  • Elevated Returns
  • Harbor
  • RealtyBits
  • RealT
  • Fluidity
  • AssetBlock
  • Realty Mogul
  • Templum
  • Smartlands
  • Brickblock
  • RealBlocks
  • Slice
  • SolidBlock
  • ShareRing
  • BrickMark
  • Others

Market Segmentation:

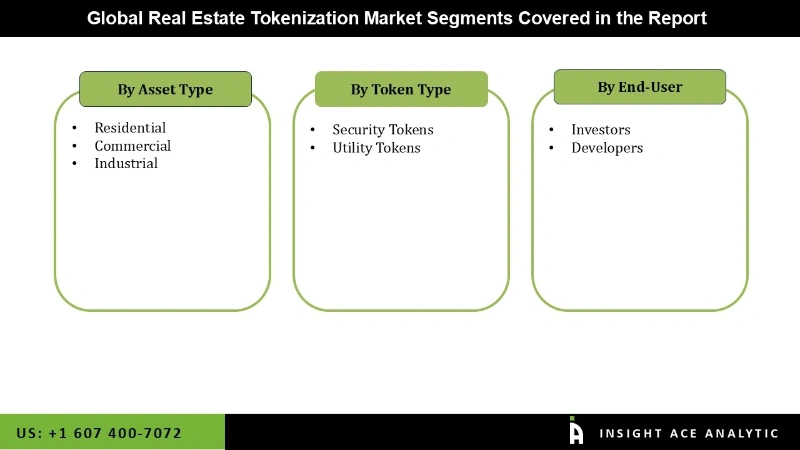
The real estate tokenization market is segmented based on asset type, token type, and end-user. By asset type, the market is divided into residential, commercial, and industrial. By token type, it is divided into security tokens and utility tokens. By end-users, it is divided into investors and developers.

Based on the Asset Type, the Commercial Segment is Accounted as a Major Contributor to the Real Estate Tokenization Market

The commercial segment is expected to hold a significant global market share in 2023 due to its substantial asset worth and the possibility of producing reliable revenue sources. Institutional and individual investors alike are drawn to commercial assets, like office spaces and retail malls, because of their diversification and stability. Real estate tokenization makes commercial real estate more accessible and attractive to a broader spectrum of investors by offering fractional ownership, more transparency, and liquidity, which is growing the worldwide market.

Investors Segment to Witness Growth at a Rapid Rate

The investor segment is expected to grow rapidly in the real estate tokenization market owing to the growing demand for easily accessible and diverse investment options. By facilitating fractional ownership through tokenization, investors can take part in highly valuable real estate with less capital outlay. The market is experiencing growth as more individuals and institutions explore tokenized real estate, drawn by the increased liquidity and transparency of blockchain technology. This, in turn, attracts investors looking for more flexible and secure investment possibilitiesFF.

In the Region, the North American Real Estate Tokenization Market Holds a Significant Revenue Share

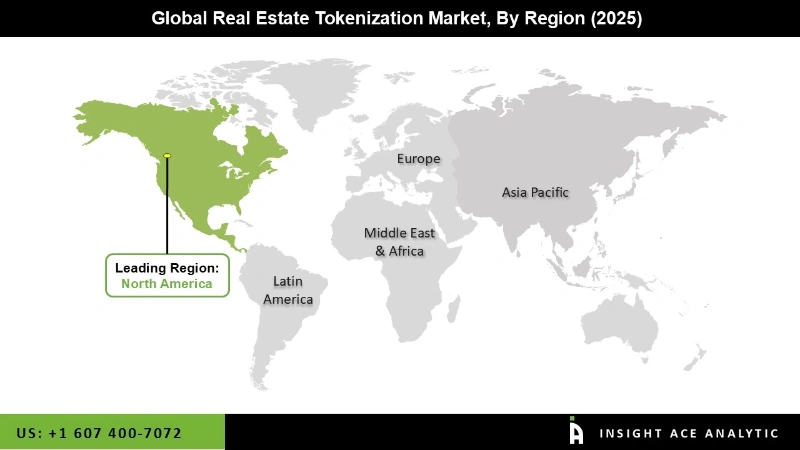
The North American real estate tokenization market is expected to register the highest market share in revenue in the near future because of the growing desire for creative financial solutions in the real estate investment market, the widespread use of blockchain technology, enabling regulatory frameworks, and a robust investor base. In addition, the Asia-Pacific region is expected to grow quickly in the global real estate tokenization market because the area is seeing fast urbanization, more technology usage, more real estate investments, and government measures that are encouraging the growth of blockchain and digital assets, which is growing the market demand in this area.
Recent Developments:

  • In June 2024, RealtyMogul, an online platform for investing in commercial real estate, hit a major milestone: its members have now put $1 billion into a variety of real estate company or “sponsor” projects, which have a total value of over $5.9 billion since the platform’s launch. A good match between the product and the market has sped up member involvement. Its more than 250,000 members have invested more than half of these funds in just the last three years, showing that investors are still interested in areas other than Wall Street, even though the economy is still unstable.
  • In July 2024, Templum, Inc., the operating system for private markets and alternative assets, is happy to announce a partnership with SoFi, the all-in-one digital personal finance company, to increase the number of investment opportunities available to everyday investors through SoFi’s new branch, Alternative Investments.

Real Estate Tokenization Market Report Scope

Report Attribute

Specifications

Market Size Value In 2023

USD 2.81 Bn

Revenue Forecast In 2031

USD 11.80 Bn

Growth Rate CAGR

CAGR of 19.9% from 2024 to 2031

Quantitative Units

Representation of revenue in US$ Bn and CAGR from 2024 to 2031

Historic Year

2019 to 2023

Forecast Year

2024-2031

Report Coverage

The forecast of revenue, the position of the company, the competitive market structure, growth prospects, and trends

Segments Covered

By Asset Type, By Token Type, By End-user and By Region

Regional Scope

North America; Europe; Asia Pacific; Latin America; Middle East & Africa

Country Scope

U.S.; Canada; U.K.; Germany; China; India; Japan; Brazil; Mexico; France; Italy; Spain; South East Asia; South Korea

Competitive Landscape

Elevated Returns, Harbor, RealtyBits, RealT, Fluidity, AssetBlock, Realty Mogul, Templum, Smartlands, Brickblock, RealBlocks, Slice, SolidBlock, ShareRing, BrickMark, and Others.

Customization Scope

Free customization report with the procurement of the report and modifications to the regional and segment scope. Particular Geographic competitive landscape.

Pricing And Available Payment Methods

Explore pricing alternatives that are customized to your particular study requirements.


Chapter 1.          Methodology and Scope

1.1.        Research Methodology

1.2.        Research Scope & Assumptions

Chapter 2.          Executive Summary

Chapter 3.          Global Real Estate Tokenization Market Snapshot

Chapter 4.          Global Real Estate Tokenization Market Variables, Trends & Scope

4.1.        Market Segmentation & Scope

4.2.        Drivers

4.3.        Challenges

4.4.        Trends

4.5.        Investment and Funding Analysis

4.6.        Industry Analysis – Porter’s Five Forces Analysis

4.7.        Competitive Landscape & Market Share Analysis

4.8.        Impact of Covid-19 Analysis

Chapter 5.          Market Segmentation 1: By Asset Type Estimates & Trend Analysis

5.1.        By Asset Type & Market Share, 2023 & 2031

5.2.        Market Size (Value (US$ Mn)) & Forecasts and Trend Analyses, 2019 to 2031 for the following By Asset Type:

5.2.1.    Residential

5.2.2.    Commercial

5.2.3.    Industrial

Chapter 6.          Market Segmentation 2: By Token Type Estimates & Trend Analysis

6.1.        By Token Type & Market Share, 2023 & 2031

6.2.        Market Size (Value (US$ Mn)) & Forecasts and Trend Analyses, 2019 to 2031 for the following By Token Type:

6.2.1.    Security Tokens

6.2.2.    Utility Tokens

Chapter 7.          Market Segmentation 3: By End-User Estimates & Trend Analysis

7.1.        By End-User & Market Share, 2023 & 2031

7.2.        Market Size (Value (US$ Mn)) & Forecasts and Trend Analyses, 2019 to 2031 for the following By End-User:

7.2.1.    Investors

7.2.2.    Developers

Chapter 8.          Real Estate Tokenization Market Segmentation 4: Regional Estimates & Trend Analysis

8.1.        North America

8.1.1.    North America Real Estate Tokenization Market Revenue (US$ Million) Estimates and Forecasts by Asset Type, 2024-2031

8.1.2.    North America Real Estate Tokenization Market Revenue (US$ Million) Estimates and Forecasts by Token Type, 2024-2031

8.1.3.    North America Real Estate Tokenization Market Revenue (US$ Million) Estimates and Forecasts by End-User, 2024-2031

8.1.4.    North America Real Estate Tokenization Market Revenue (US$ Million) Estimates and Forecasts by country, 2024-2031.

8.2.        Europe

8.2.1.    Europe Real Estate Tokenization Market Revenue (US$ Million) Estimates and Forecasts by Asset Type, 2024-2031

8.2.2.    Europe Real Estate Tokenization Market Revenue (US$ Million) Estimates and Forecasts by Token Type, 2024-2031

8.2.3.    Europe Real Estate Tokenization Market Revenue (US$ Million) Estimates and Forecasts by End-User, 2024-2031

8.2.4.    Europe Real Estate Tokenization Market Revenue (US$ Million) Estimates and Forecasts by country, 2024-2031

8.3.        Asia Pacific

8.3.1.    Asia Pacific Real Estate Tokenization Market Revenue (US$ Million) Estimates and Forecasts by Asset Type, 2024-2031

8.3.2.    Asia Pacific Real Estate Tokenization Market Revenue (US$ Million) Estimates and Forecasts by Token Type, 2024-2031

8.3.3.    Asia Pacific Real Estate Tokenization Market Revenue (US$ Million) Estimates and Forecasts by End-User, 2024-2031

8.3.4.    Asia Pacific Real Estate Tokenization Market Revenue (US$ Million) Estimates and Forecasts by country, 2024-2031

8.4.        Latin America

8.4.1.    Asia Pacific Real Estate Tokenization Market Revenue (US$ Million) Estimates and Forecasts by Asset Type, 2024-2031

8.4.2.    Latin America Real Estate Tokenization Market Revenue (US$ Million) Estimates and Forecasts by Token Type, 2024-2031

8.4.3.    Latin America Real Estate Tokenization Market Revenue (US$ Million) Estimates and Forecasts by End-User, 2024-2031

8.4.4.    Latin America Real Estate Tokenization Market Revenue (US$ Million) Estimates and Forecasts by country, 2024-2031.

8.5.        Middle East & Africa

8.5.1.    Middle East & Africa Real Estate Tokenization Market Revenue (US$ Million) Estimates and Forecasts by Asset Type, 2024-2031

8.5.2.    Middle East & Africa Real Estate Tokenization Market Revenue (US$ Million) Estimates and Forecasts by Token Type, 2024-2031

8.5.3.    Middle East & Africa Real Estate Tokenization Market Revenue (US$ Million) Estimates and Forecasts by End-User, 2024-2031

8.5.4.    Middle East & Africa Real Estate Tokenization Market Revenue (US$ Million) Estimates and Forecasts by country, 2024-2031

Chapter 9.          Competitive Landscape

9.1.        Major Mergers and Acquisitions/Strategic Alliances

9.2.        Company Profiles


9.2.1.    Elevated Returns

9.2.2.    Harbor

9.2.3.    RealtyBits

9.2.4.    RealT

9.2.5.    Fluidity

9.2.6.    AssetBlock

9.2.7.    Realty Mogul

9.2.8.    Templum

9.2.9.    Smartlands

9.2.10.  Brickblock

9.2.11.  RealBlocks

9.2.12.  Slice

9.2.13.  SolidBlock

9.2.14.  ShareRing

9.2.15.  BrickMark

9.2.16.  Other Prominent Players

Segmentation of Real Estate Tokenization Market

Real Estate Tokenization Market- By Asset Type
  • Residential
  • Commercial
  • Industrial

real estate

Real Estate Tokenization Market- By Token Type

  • Security Tokens
  • Utility Tokens

Real Estate Tokenization Market- By End-User

  • Investors
  • Developers

Real Estate Tokenization Market- By Region

North America-

  • The US
  • Canada
  • Mexico

Europe-

  • Germany
  • The UK
  • France
  • Italy
  • Spain
  • Rest of Europe

Asia-Pacific-

  • China
  • Japan
  • India
  • South Korea
  • South East Asia
  • Rest of Asia Pacific

Latin America-

  • Brazil
  • Argentina
  • Rest of Latin America

 Middle East & Africa-

  • GCC Countries
  • South Africa
  • Rest of the Middle East and Africa


InsightAce Analytic follows a standard and comprehensive market research methodology focused on offering the most accurate and precise market insights. The methods followed for all our market research studies include three significant steps – primary research, secondary research, and data modeling and analysis - to derive the current market size and forecast it over the forecast period. In this study, these three steps were used iteratively to generate valid data points (minimum deviation), which were cross-validated through multiple approaches mentioned below in the data modeling section.

Through secondary research methods, information on the market under study, its peer, and the parent market was collected. This information was then entered into data models. The resulted data points and insights were then validated by primary participants.

Based on additional insights from these primary participants, more directional efforts were put into doing secondary research and optimize data models. This process was repeated till all data models used in the study produced similar results (with minimum deviation). This way, this iterative process was able to generate the most accurate market numbers and qualitative insights.

Secondary research

The secondary research sources that are typically mentioned to include, but are not limited to:

  • Company websites, financial reports, annual reports, investor presentations, broker reports, and SEC filings.
  • External and internal proprietary databases, regulatory databases, and relevant patent analysis
  • Statistical databases, National government documents, and market reports
  • Press releases, news articles, and webcasts specific to the companies operating in the market

The paid sources for secondary research like Factiva, OneSource, Hoovers, and Statista

Primary Research:

Primary research involves telephonic interviews, e-mail interactions, as well as face-to-face interviews for each market, category, segment, and subsegment across geographies

The contributors who typically take part in such a course include, but are not limited to: 

  • Industry participants: CEOs, CBO, CMO, VPs, marketing/ type managers, corporate strategy managers, and national sales managers, technical personnel, purchasing managers, resellers, and distributors.
  • Outside experts: Valuation experts, Investment bankers, research analysts specializing in specific markets
  • Key opinion leaders (KOLs) specializing in unique areas corresponding to various industry verticals
  • End-users: Vary mainly depending upon the market

Data Modeling and Analysis:

In the iterative process (mentioned above), data models received inputs from primary as well as secondary sources. But analysts working on these models were the key. They used their extensive knowledge and experience about industry and topic to make changes and fine-tuning these models as per the product/service under study.

The standard data models used while studying this market were the top-down and bottom-up approaches and the company shares analysis model. However, other methods were also used along with these – which were specific to the industry and product/service under study.

user icon
office icon
mail icon
call icon

This website is secure, and we do not share your personal information with any third party. Privacy Policy

Need Customization
Need specific information/chapter from the report of the custom data table, graph or complete report? Tell us more.

Frequently Asked Questions

How big is the Real Estate Tokenization Market Size?

The Real Estate Tokenization Market is expected to grow at a 19.9% CAGR during the forecast period for 2024-2031.

Elevated Returns, Harbor, RealtyBits, RealT, Fluidity, AssetBlock, Realty Mogul, Templum, Smartlands, Brickblock, RealBlocks, Slice, SolidBlock, Share

Our Clients

  • client logo
  • client logo
  • client logo
  • client logo
  • client logo
  • client logo
  • client logo
  • client logo
  • client logo
  • client logo
  • client logo
  • client logo
  • client logo
  • client logo
  • client logo
  • client logo
  • client logo
  • client logo
  • client logo
  • client logo
  • client logo
  • client logo
  • client logo
  • client logo
  • client logo
  • client logo
  • client logo
  • client logo
  • client logo
  • client logo
  • client logo
  • client logo
  • client logo
  • client logo
  • client logo
  • client logo
  • client logo
  • client logo
  • client logo
  • client logo

Media Citations

  • media citation logo
  • media citation logo
  • media citation logo
  • media citation logo
  • media citation logo
  • media citation logo
  • media citation logo
  • media citation logo
  • media citation logo

Growth opportunities and latent adjacency in Consumer Goods & Services

Select Licence Type
$4456
$7786
$10000
$1200
Get Your GTM Strategy

Navigate market entry with channel selection, launch strategy & timeline, and pricing model support.

Equip yourself with the insights needed to develop a winning go-to-market strategy

Get real-time updates and joint control over project direction with our collaborative approach