
The Portable Power Stations Market Size is valued at USD 628.1 Mn in 2023 and is predicted to reach USD 1,169.4 Mn by the year 2031 at an 8.33% CAGR during the forecast period for 2024-2031.

A portable power station is a device equipped with a rechargeable battery, providing a cleaner and safer way to power appliances without much noise and with easy portability. These machines feature multiple USB and AC connectors, enabling users to charge and operate various devices with ease. Typically, most portable power stations use either lithium-ion or lithium-iron phosphate (LiFePO4) batteries, with LiFePO4 being favored for its durability and heat resistance, making it ideal for high-power applications. Portable power stations are especially popular for outdoor activities and off-grid adventures, where they can charge GPS devices, phones, lanterns, cameras, and even small cooking appliances. In addition, solar-rechargeable models are a preferred choice for those seeking sustainable energy solutions. These power stations are also useful for home projects, offering portable power that reduces dependency on extension cords and allows for flexibility in work location.
Many portable power stations offer advanced features, such as smartphone app control, enabling users to monitor battery levels, adjust output settings, and receive notifications. Some models also include built-in air compressors for inflating tires, sports equipment, and more, while others come with integrated solar panels for more efficient and sustainable charging. Growing awareness of climate change and environmental impact has created a shift towards clean, emissions-free power solutions, making portable power stations an attractive alternative to traditional gas generators. They produce no emissions, operate quietly, and are ideal for both indoor and outdoor use. Additionally, many portable power stations are compatible with external solar panels, allowing eco-conscious consumers and outdoor enthusiasts to recharge sustainably and independently of the grid, further positioning portable power stations as a popular choice in renewable energy markets.
The Portable Power Stations market is segmented based on technology, application, and capacity. Based on the technology, the market is divided into lithium-ion, lead-acid, and fuel cell vehicle (FCV). Based on the application, the market is divided into emergency, off-grid, and automotive. Based on the capacity, the market is divided into under 300 Wh, 300-600 Wh, and above 600 Wh.
Based on the technology, the market is divided into lithium-ion, lead-acid, and fuel cell vehicle (FCV). Among these, the lithium-ion segment is expected to have the highest growth rate during the forecast period. Lithium-ion batteries have a high energy-to-weight ratio, meaning they can store more energy in a compact and lightweight form. This makes portable power stations lighter, smaller, and easier to transport, which is crucial for applications like camping, road trips, and emergency backup.
Lithium-ion batteries have a higher cycle life than lead-acid batteries, retaining their capacity for more charge-discharge cycles. This longevity reduces the need for frequent replacements, which is attractive for both individual consumers and businesses looking to reduce long-term costs. Lithium-ion batteries are more energy-efficient, with lower internal resistance and less self-discharge than lead-acid options. This means users get more consistent power output with minimal maintenance, making lithium-ion stations convenient and reliable for various applications. Many lithium-ion portable power stations are designed to work with solar panels, appealing to eco-conscious consumers and outdoor enthusiasts looking for sustainable power solutions.
Based on the application, the market is divided into emergency, off-grid, and automotive. Natural disasters like hurricanes, wildfires, earthquakes, and severe storms are becoming more frequent and intense, often resulting in extended power outages. Portable power stations provide an immediate, portable solution for households and businesses to power essential devices during these disruptions. Aging infrastructure and rising energy demand have led to a growing number of power outages and rolling blackouts, particularly in regions with overburdened or vulnerable power grids. With portable power stations, users have access to backup power that doesn’t rely on the grid, offering peace of mind and continuity during outages.
Portable power stations are user-friendly, requiring little setup or maintenance, making them accessible even for those unfamiliar with power equipment. Many also support recharging via solar panels, car chargers, or wall outlets, ensuring they can be refueled even in prolonged emergency situations. These factors make the emergency power segment the dominant driver of the portable power station market.
Increasing awareness and preparedness for natural disasters have led many North American households to invest in emergency kits, often including portable power stations. These devices offer a quiet, safe, and versatile alternative to gas generators, meeting consumer preferences for easy and efficient power solutions. The strong culture of outdoor activities, including camping, hiking, and RV travel, creates a consistent demand for portable power stations. With the rise of “glamping” (luxury camping) and remote work, outdoor enthusiasts seek reliable power sources to charge phones, laptops, and other small appliances during off-grid trips. The interest in clean energy solutions and sustainability is high in North America, leading to increased adoption of portable power stations that support solar charging. Many consumers are also eco-conscious, preferring emissions-free battery power stations over fossil-fuel-powered generators.
|
Report Attribute |
Specifications |
|
Market Size Value In 2023 |
USD 628.1 Mn |
|
Revenue Forecast In 2031 |
USD 1,169.4 Mn |
|
Growth Rate CAGR |
CAGR of 8.33% from 2024 to 2031 |
|
Quantitative Units |
Representation of revenue in US$ Bn and CAGR from 2024 to 2031 |
|
Historic Year |
2019 to 2023 |
|
Forecast Year |
2024-2031 |
|
Report Coverage |
The forecast of revenue, the position of the company, the competitive market structure, growth prospects, and trends |
|
Segments Covered |
By Technology, Application, and Capacity |
|
Regional Scope |
North America; Europe; Asia Pacific; Latin America; Middle East & Africa |
|
Country Scope |
U.S.; Canada; U.K.; Germany; China; India; Japan; Brazil; Mexico; The UK; France; Italy; Spain; China; Japan; India; South Korea; Southeast Asia; South Korea; South East Asia |
|
Competitive Landscape |
Jackery, Inc., Goal Zero, Bluetti, Anker Innovations, EcoFlow, Yeti, Renogy, Paxcess, AIMTOM, RAVPower, ChargeTech, Duracell Inc, iForway, Lion Energy, Lipower Technology Co., Ltd, Midland Radio, Chargetech, Drow Enterprise Co., Ltd., Generac Power Systems, Inc., Suaoki, Milwaukee Tool. |
|
Customization Scope |
Free customization report with the procurement of the report and modifications to the regional and segment scope. Particular Geographic competitive landscape. |
|
Pricing and Available Payment Methods |
Explore pricing alternatives that are customized to your particular study requirements. |
Chapter 1. Methodology and Scope
1.1. Research Methodology
1.2. Research Scope & Assumptions
Chapter 2. Executive Summary
Chapter 3. Global Portable Power Stations Market Snapshot
Chapter 4. Global Portable Power Stations Market Variables, Trends & Scope
4.1. Market Segmentation & Scope
4.2. Drivers
4.3. Challenges
4.4. Trends
4.5. Investment and Funding Analysis
4.6. Porter's Five Forces Analysis
4.7. Incremental Opportunity Analysis (US$ MN), 2024-2031
4.8. Global Portable Power Stations Market Penetration & Growth Prospect Mapping (US$ Mn), 2023-2031
4.9. Competitive Landscape & Market Share Analysis, By Key Player (2023)
4.10. Use/impact of AI on Portable Power Stations Industry Trends
Chapter 5. Portable Power Stations Market Segmentation 1: By Technology, Estimates & Trend Analysis
5.1. Market Share by Technology, 2023 & 2031
5.2. Market Size (Value US$ Mn) & Forecasts and Trend Analyses, 2019 to 2031 for the following Technology:
5.2.1. Lithium-ion
5.2.2. Lead-acid
5.2.3. Fuel Cell Vehicle (FCV)
Chapter 6. Portable Power Stations Market Segmentation 2: By Application, Estimates & Trend Analysis
6.1. Market Share by Application, 2023 & 2031
6.2. Market Size (Value US$ Mn) & Forecasts and Trend Analyses, 2019 to 2031 for the following Applications:
6.2.1. Emergency
6.2.2. Off-grid
6.2.3. Automotive
Chapter 7. Portable Power Stations Market Segmentation 3: By Capacity, Estimates & Trend Analysis
7.1. Market Share by Capacity, 2023 & 2031
7.2. Market Size (Value US$ Mn) & Forecasts and Trend Analyses, 2019 to 2031 for the following Capacitys:
7.2.1. Under 300 Wh
7.2.2. 300-600 Wh
7.2.3. Above 600 Wh
Chapter 8. Portable Power Stations Market Segmentation 6: Regional Estimates & Trend Analysis
8.1. Global Portable Power Stations Market, Regional Snapshot 2023 & 2031
8.2. North America
8.2.1. North America Portable Power Stations Market Revenue (US$ Million) Estimates and Forecasts by Country, 2024-2031
8.2.1.1. US
8.2.1.2. Canada
8.2.2. North America Portable Power Stations Market Revenue (US$ Million) Estimates and Forecasts by Technology, 2024-2031
8.2.3. North America Portable Power Stations Market Revenue (US$ Million) Estimates and Forecasts by Application, 2024-2031
8.2.4. North America Portable Power Stations Market Revenue (US$ Million) Estimates and Forecasts by Capacity, 2024-2031
8.3. Europe
8.3.1. Europe Portable Power Stations Market Revenue (US$ Million) Estimates and Forecasts by Country, 2024-2031
8.3.1.1. Germany
8.3.1.2. U.K.
8.3.1.3. France
8.3.1.4. Italy
8.3.1.5. Spain
8.3.1.6. Rest of Europe
8.3.2. Europe Portable Power Stations Market Revenue (US$ Million) Estimates and Forecasts by Technology, 2024-2031
8.3.3. Europe Portable Power Stations Market Revenue (US$ Million) Estimates and Forecasts by Application, 2024-2031
8.3.4. Europe Portable Power Stations Market Revenue (US$ Million) Estimates and Forecasts by Capacity, 2024-2031
8.4. Asia Pacific
8.4.1. Asia Pacific Portable Power Stations Market Revenue (US$ Million) Estimates and Forecasts by Country, 2024-2031
8.4.1.1. India
8.4.1.2. China
8.4.1.3. Japan
8.4.1.4. Australia
8.4.1.5. South Korea
8.4.1.6. Hong Kong
8.4.1.7. Southeast Asia
8.4.1.8. Rest of Asia Pacific
8.4.2. Asia Pacific Portable Power Stations Market Revenue (US$ Million) Estimates and Forecasts by Technology, 2024-2031
8.4.3. Asia Pacific Portable Power Stations Market Revenue (US$ Million) Estimates and Forecasts by Application, 2024-2031
8.4.4. Asia Pacific Portable Power Stations Market Revenue (US$ Million) Estimates and Forecasts By Capacity, 2024-2031
8.5. Latin America
8.5.1. Latin America Portable Power Stations Market Revenue (US$ Million) Estimates and Forecasts by Country, 2024-2031
8.5.1.1. Brazil
8.5.1.2. Mexico
8.5.1.3. Rest of Latin America
8.5.2. Latin America Portable Power Stations Market Revenue (US$ Million) Estimates and Forecasts by Technology, 2024-2031
8.5.3. Latin America Portable Power Stations Market Revenue (US$ Million) Estimates and Forecasts by Application, 2024-2031
8.5.4. Latin America Portable Power Stations Market Revenue (US$ Million) Estimates and Forecasts by Capacity, 2024-2031
8.6. Middle East & Africa
8.6.1. Middle East & Africa Portable Power Stations Market Revenue (US$ Million) Estimates and Forecasts by country, 2024-2031
8.6.1.1. GCC Countries
8.6.1.2. Israel
8.6.1.3. South Africa
8.6.1.4. Rest of Middle East and Africa
8.6.2. Middle East & Africa Portable Power Stations Market Revenue (US$ Million) Estimates and Forecasts by Technology, 2024-2031
8.6.3. Middle East & Africa Portable Power Stations Market Revenue (US$ Million) Estimates and Forecasts by application, 2024-2031
8.6.4. Middle East & Africa Portable Power Stations Market Revenue (US$ Million) Estimates and Forecasts by Capacity, 2024-2031
Chapter 9. Competitive Landscape
9.1. Major Mergers and Acquisitions/Strategic Alliances
9.2. Company Profiles
9.2.1. Jackery, Inc.
9.2.1.1. Business Overview
9.2.1.2. Key Product/Service Offerings
9.2.1.3. Financial Performance
9.2.1.4. Geographical Presence
9.2.1.5. Recent Developments with Business Strategy
9.2.2. Goal Zero (Nielsen) Bluetti
9.2.3. Anker Innovations
9.2.4. EcoFlow
9.2.5. Yeti (by Goal Zero)
9.2.6. Renogy
9.2.7. Paxcess
9.2.8. AIMTOM
9.2.9. RAVPower
9.2.10. ChargeTech
9.2.11. Duracell Inc
9.2.12. iForway
9.2.13. Lion Energy
9.2.14. Lipower Technology Co., Ltd
9.2.15. Midland Radio
9.2.16. Chargetech
9.2.17. Duracell Inc.
9.2.18. Drow Enterprise Co., Ltd.
9.2.19. Generac Power Systems, Inc.
9.2.20. Suaoki
9.2.21. Milwaukee Tool
Global Portable Power Stations Market- By Capacity

Global Portable Power Stations Market – By Technology
Global Portable Power Stations Market – By Application
Global Portable Power Stations Market – By Region
North America-
Europe-
Asia-Pacific-
Latin America-
Middle East & Africa-
InsightAce Analytic follows a standard and comprehensive market research methodology focused on offering the most accurate and precise market insights. The methods followed for all our market research studies include three significant steps – primary research, secondary research, and data modeling and analysis - to derive the current market size and forecast it over the forecast period. In this study, these three steps were used iteratively to generate valid data points (minimum deviation), which were cross-validated through multiple approaches mentioned below in the data modeling section.
Through secondary research methods, information on the market under study, its peer, and the parent market was collected. This information was then entered into data models. The resulted data points and insights were then validated by primary participants.
Based on additional insights from these primary participants, more directional efforts were put into doing secondary research and optimize data models. This process was repeated till all data models used in the study produced similar results (with minimum deviation). This way, this iterative process was able to generate the most accurate market numbers and qualitative insights.
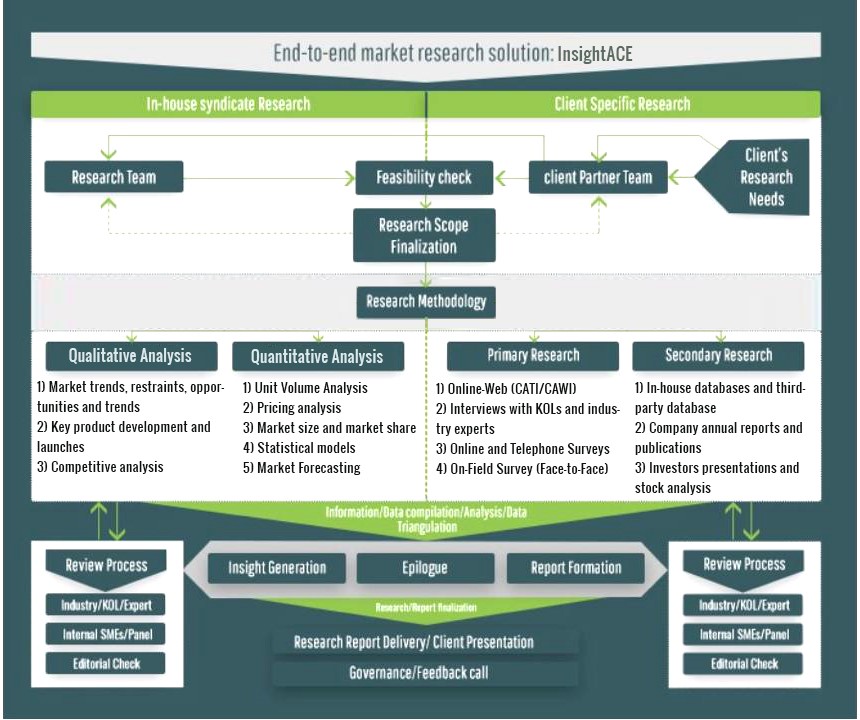
Secondary research
The secondary research sources that are typically mentioned to include, but are not limited to:
The paid sources for secondary research like Factiva, OneSource, Hoovers, and Statista
Primary Research:
Primary research involves telephonic interviews, e-mail interactions, as well as face-to-face interviews for each market, category, segment, and subsegment across geographies
The contributors who typically take part in such a course include, but are not limited to:
Data Modeling and Analysis:
In the iterative process (mentioned above), data models received inputs from primary as well as secondary sources. But analysts working on these models were the key. They used their extensive knowledge and experience about industry and topic to make changes and fine-tuning these models as per the product/service under study.
The standard data models used while studying this market were the top-down and bottom-up approaches and the company shares analysis model. However, other methods were also used along with these – which were specific to the industry and product/service under study.
