
The Nutraceutical Excipients Market Size is valued at USD 4.16 Bn in 2023 and is predicted to reach USD 7.70 Bn by the year 2031 at an 8.2% CAGR during the forecast period for 2024-2031.

Nutraceutical excipients, once simple and inert compounds, have evolved into sophisticated substances critical to modern drug delivery systems. These excipients, derived from both pharmaceutical and nutritional sources, play a vital role in enhancing the bioavailability, stability, and absorption of active pharmaceutical ingredients (API) in medications. While they possess no therapeutic value on their own, they enable the formulation of functional foods and supplements that optimize the potency and efficacy of medications. As analytical techniques advance and excipient monographs are harmonized, the future of excipient science continues to evolve. This progression has been further driven by the rising costs of healthcare, emphasizing the importance of nutraceutical excipients in improving patient outcomes and promoting tolerance to medications.
Nutraceuticals are products derived from naturally occurring ingredients that are extracted, isolated, and purified from both food and non-food sources, providing specific physiological benefits when consumed in appropriate amounts to promote good health. In India, these products are regulated by the Food Safety and Standards Authority of India (FSSAI) under the Food Safety and Standards Act, 2006 (FSS Act). The FSSAI establishes various regulations to ensure the safety, quality, and efficacy of nutraceuticals in the Indian market, safeguarding public health by enforcing standards for production, labeling, and marketing of these health-promoting products. Nutraceutical excipient producers have possibilities to build their businesses and satisfy the growing demand in the nutraceutical excipients market due to the global nutraceutical market's expansion, which is being driven by changes in food preferences, lifestyle choices, and health consciousness.
The Nutraceutical Excipients Market segment is based on product source, end product, and formulation, functionality application. Based on the product source, the market is segmented organic chemicals, and inorganic chemicals. Based on functionality, the market is categorized into binders, colorants, flavors & sweeteners. Based on the end product, the market is divided into protein & amino acids, omega-3 fatty acids, vitamins, minerals, prebiotics, probiotics others. Based on the formulation, the market is divided into dry, tablets, capsules, liquid, and others. Based on the functionality application, the market is divided into taste masking, stabilizers, modified-release solubility & bioavailability, and others
Based on the product source, the market is segmented organic chemicals, and inorganic chemicals. Among these, the organic chemicals segment is expected to have the highest growth rate during the forecast period. This is primarily due to the versatility and functional properties they offer, which are essential for formulating dietary supplements. Organic excipients, such as carbohydrates, proteins, and fats, are widely used due to their compatibility with the active ingredients in nutraceutical formulations. Many organic excipients are derived from renewable resources, making them environmentally sustainable. Additionally, they are generally considered safer, with fewer side effects or risks of toxicity, which is important for the growing segment of health-conscious consumers.
Based on functionality, the market is categorized into binders, colorants, flavors & sweeteners. Among these, the binders segment dominates the market, because Binders are used across a variety of nutraceutical forms, including tablets, capsules, and even powders, providing versatility in formulation. Binders help enhance the stability of active ingredients, preventing degradation during production, storage, and consumption, which is essential for maintaining the efficacy of nutraceuticals. Binders are indispensable for ensuring that the ingredients in tablets and capsules remain intact, making them a critical component in solid dosage forms, which are the most common types of nutraceutical products.
North America, particularly the United States and Canada, leads in the nutraceutical excipients market due to high consumer demand for dietary supplements and functional foods. The United States led North America in revenue, and the region accounted for the biggest proportion of the market for nutraceutical excipients. In example, the healthcare infrastructure in the United States is highly developed and consists of manufacturing facilities, pharmaceutical businesses, and research organizations. Research, development, and manufacturing of nutraceutical products including those that make use of specialty excipients are supported by this infrastructure.
|
Report Attribute |
Specifications |
|
Market Size Value In 2023 |
USD 4.16 Bn |
|
Revenue Forecast In 2031 |
USD 7.70 Bn |
|
Growth Rate CAGR |
CAGR of 8.2% from 2024 to 2031 |
|
Quantitative Units |
Representation of revenue in US$ Bn and CAGR from 2024 to 2031 |
|
Historic Year |
2019 to 2023 |
|
Forecast Year |
2024-2031 |
|
Report Coverage |
The forecast of revenue, the position of the company, the competitive market structure, growth prospects, and trends |
|
Segments Covered |
Product Source, End Product, And Formulation, Functionality Application. |
|
Regional Scope |
North America; Europe; Asia Pacific; Latin America; Middle East & Africa |
|
Country Scope |
U.S.; Canada; U.K.; Germany; China; India; Japan; Brazil; Mexico; France; Italy; Spain; South Korea; South East Asia |
|
Competitive Landscape |
International Flavors & Fragrances Inc, Kerry Group Plc, Ingredion, Sensient Technologies Corporation, Associated British Foods Plc, Basf SE, Roquette Frères, Meggle Group Gmbh, Cargill, Incorporated, Ashland, Azelis Group, Imcd, Hilmar Cheese Company, Inc., Seppic, Biogrund Gmbh, Dow Du Pont Inc., Lubrizol Corporation, SPI Pharma Inc., Innophos, Jrs Pharma, Galenova Inc., BINDERS, Daicel Corporation, Alsiano A/S, Colorcon, Panchamrut Chemicals, Omya, Gattefossé, Fuji Chemical Industries Co., Ltd, Jigs Chemical |
|
Customization Scope |
Free customization report with the procurement of the report, Modifications to the regional and segment scope. Particular Geographic competitive landscape. |
|
Pricing and Available Payment Methods |
Explore pricing alternatives that are customized to your particular study requirements. |
Chapter 1. Methodology and Scope
1.1. Research Methodology
1.2. Research Scope & Assumptions
Chapter 2. Executive Summary
Chapter 3. Global Nutraceutical Excipients Market Snapshot
Chapter 4. Global Nutraceutical Excipients Market Variables, Trends & Scope
4.1. Market Segmentation & Scope
4.2. Drivers
4.3. Challenges
4.4. Trends
4.5. Investment and Funding Analysis
4.6. Industry Analysis – Porter’s Five Forces Analysis
4.7. Competitive Landscape & Market Share Analysis
4.8. Impact of Covid-19 Analysis
Chapter 5. Market Segmentation 1: by Product Source Estimates & Trend Analysis
5.1. by Product Source & Market Share, 2019 & 2031
5.2. Market Size (Value (US$ Mn)) & Forecasts and Trend Analyses, 2019 to 2031 for the following by Product Source:
5.2.1. Organic Chemicals
5.2.2. Inorganic Chemicals
5.2.3. Other Chemicals
Chapter 6. Market Segmentation 2: By Functionality Estimates & Trend Analysis
6.1. By Functionality & Market Share, 2019 & 2031
6.2. Market Size (Value (US$ Mn)) & Forecasts and Trend Analyses, 2019 to 2031 for the following By Functionality:
6.2.1. Fillers & Diluents
6.2.2. Suspending & Viscosity Agents
6.2.3. Coating Agents
6.2.4. Binders
6.2.5. Flavoring Agents & Sweeteners
6.2.6. Disintegrants
6.2.7. Colorants
6.2.8. Lubricants & Glidants
6.2.9. Preservatives
6.2.10. Emulsifying Agents
6.2.11. Other Functionalities
Chapter 7. Market Segmentation 3: By Formulation Estimates & Trend Analysis
7.1. By Formulation & Market Share, 2019 & 2031
7.2. Market Size (Value (US$ Mn)) & Forecasts and Trend Analyses, 2019 to 2031 for the following By Formulation:
7.2.1. Dry
7.2.1.1. Tablets
7.2.1.2. Capsules
7.2.2. Liquid
7.2.3. Other Formulations
Chapter 8. Market Segmentation 4: By Functionality Application Estimates & Trend Analysis
8.1. By Functionality Application & Market Share, 2019 & 2031
8.2. Market Size (Value (US$ Mn)) & Forecasts and Trend Analyses, 2019 to 2031 for the following By Functionality Application:
8.2.1. Taste Masking
8.2.2. Stabilizers
8.2.3. Modified-Release
8.2.4. Solubility & Bioavailability
8.2.5. Others
Chapter 9. Market Segmentation 5: by End Product Estimates & Trend Analysis
9.1. By End Product & Market Share, 2019 & 2031
9.2. Market Size (Value (US$ Mn)) & Forecasts and Trend Analyses, 2019 to 2031 for the following by End Product:
9.2.1. Protein & Amino Acids
9.2.2. Omega-3 Fatty Acids
9.2.3. Vitamins
9.2.4. Minerals
9.2.5. Prebiotics
9.2.6. Probiotics
9.2.7. Other End Products
Chapter 10. Nutraceutical Excipients Market Segmentation 6: Regional Estimates & Trend Analysis
10.1. North America
10.1.1. North America Nutraceutical Excipients Market Revenue (US$ Million) Estimates and Forecasts by Product Source, 2024-2031
10.1.2. North America Nutraceutical Excipients Market Revenue (US$ Million) Estimates and Forecasts by Functionality, 2024-2031
10.1.3. North America Nutraceutical Excipients Market Revenue (US$ Million) Estimates and Forecasts by Formulation, 2024-2031
10.1.4. North America Nutraceutical Excipients Market Revenue (US$ Million) Estimates and Forecasts by Functionality Application, 2024-2031
10.1.5. North America Nutraceutical Excipients Market Revenue (US$ Million) Estimates and Forecasts by End Product, 2024-2031
10.1.6. North America Nutraceutical Excipients Market Revenue (US$ Million) Estimates and Forecasts by country, 2024-2031
10.2. Europe
10.2.1. Europe Nutraceutical Excipients Market Revenue (US$ Million) Estimates and Forecasts by Product Source, 2024-2031
10.2.2. Europe Nutraceutical Excipients Market Revenue (US$ Million) Estimates and Forecasts by Functionality, 2024-2031
10.2.3. Europe Nutraceutical Excipients Market Revenue (US$ Million) Estimates and Forecasts by Formulation, 2024-2031
10.2.4. Europe Nutraceutical Excipients Market Revenue (US$ Million) Estimates and Forecasts by Functionality Application, 2024-2031
10.2.5. Europe Nutraceutical Excipients Market Revenue (US$ Million) Estimates and Forecasts by End Product, 2024-2031
10.2.6. Europe Nutraceutical Excipients Market Revenue (US$ Million) Estimates and Forecasts by country, 2024-2031
10.3. Asia Pacific
10.3.1. Asia Pacific Nutraceutical Excipients Market Revenue (US$ Million) Estimates and Forecasts by Product Source, 2024-2031
10.3.2. Asia Pacific Nutraceutical Excipients Market Revenue (US$ Million) Estimates and Forecasts by Functionality, 2024-2031
10.3.3. Asia-Pacific Nutraceutical Excipients Market Revenue (US$ Million) Estimates and Forecasts by Formulation, 2024-2031
10.3.4. Asia-Pacific Nutraceutical Excipients Market Revenue (US$ Million) Estimates and Forecasts by Functionality Application, 2024-2031
10.3.5. Asia-Pacific Nutraceutical Excipients Market Revenue (US$ Million) Estimates and Forecasts by End Product, 2024-2031
10.3.6. Asia Pacific Nutraceutical Excipients Market Revenue (US$ Million) Estimates and Forecasts by country, 2024-2031
10.4. Latin America
10.4.1. Latin America Nutraceutical Excipients Market Revenue (US$ Million) Estimates and Forecasts by Product Source, 2024-2031
10.4.2. Latin America Nutraceutical Excipients Market Revenue (US$ Million) Estimates and Forecasts by Functionality, 2024-2031
10.4.3. Latin America Nutraceutical Excipients Market Revenue (US$ Million) Estimates and Forecasts by Formulation, 2024-2031
10.4.4. Latin America Nutraceutical Excipients Market Revenue (US$ Million) Estimates and Forecasts by Functionality Application, 2024-2031
10.4.5. Latin America Nutraceutical Excipients Market Revenue (US$ Million) Estimates and Forecasts by End Product, 2024-2031
10.4.6. Latin America Nutraceutical Excipients Market Revenue (US$ Million) Estimates and Forecasts by country, 2024-2031
10.5. Middle East & Africa
10.5.1. Middle East & Africa Nutraceutical Excipients Market Revenue (US$ Million) Estimates and Forecasts by Product Source, 2024-2031
10.5.2. Middle East & Africa Nutraceutical Excipients Market Revenue (US$ Million) Estimates and Forecasts by Functionality, 2024-2031
10.5.3. Middle East & Africa Nutraceutical Excipients Market Revenue (US$ Million) Estimates and Forecasts by Formulation, 2024-2031
10.5.4. Middle East & Africa Nutraceutical Excipients Market Revenue (US$ Million) Estimates and Forecasts by Functionality Application, 2024-2031
10.5.5. Middle East & Africa Nutraceutical Excipients Market Revenue (US$ Million) Estimates and by End Product, 2024-2031
10.5.6. Middle East & Africa Nutraceutical Excipients Market Revenue (US$ Million) Estimates and Forecasts by country, 2024-2031
Chapter 11. Competitive Landscape
11.1. Major Mergers and Acquisitions/Strategic Alliances
11.2. Company Profiles
11.2.1. International Flavors & Fragrances Inc
11.2.2. Kerry Group Plc
11.2.3. Ingredion
11.2.4. Sensient Technologies Corporation
11.2.5. Associated British Foods Plc
11.2.6. Basf SE
11.2.7. Roquette Frères
11.2.8. Meggle Group Gmbh
11.2.9. Cargill, Incorporated
11.2.10. Ashland
11.2.11. Azelis Group
11.2.12. Imcd
11.2.13. Hilmar Cheese Company, Inc.
11.2.14. Seppic
11.2.15. Biogrund Gmbh
11.2.16. Dow Du Pont Inc.
11.2.17. Lubrizol Corporation
11.2.18. SPI Pharma Inc.
11.2.19. Innophos
11.2.20. Jrs Pharma
11.2.21. Galenova Inc.
11.2.22. BINDERS
11.2.23. Daicel Corporation
11.2.24. Alsiano A/S
11.2.25. Colorcon
11.2.26. Panchamrut Chemicals
11.2.27. Omya
11.2.28. Gattefossé
11.2.29. Fuji Chemical Industries Co., Ltd
11.2.30. Jigs Chemical
Global Nutraceutical Excipients Market – By Product Source

Global Nutraceutical Excipients Market – By Functionality
Global Nutraceutical Excipients Market – By Formulation
Global Nutraceutical Excipients Market – By Functionality Application
Global Nutraceutical Excipients Market – By End Product
Global Nutraceutical Excipients Market – By Region
North America-
Europe-
Asia-Pacific-
Latin America-
Middle East & Africa-
InsightAce Analytic follows a standard and comprehensive market research methodology focused on offering the most accurate and precise market insights. The methods followed for all our market research studies include three significant steps – primary research, secondary research, and data modeling and analysis - to derive the current market size and forecast it over the forecast period. In this study, these three steps were used iteratively to generate valid data points (minimum deviation), which were cross-validated through multiple approaches mentioned below in the data modeling section.
Through secondary research methods, information on the market under study, its peer, and the parent market was collected. This information was then entered into data models. The resulted data points and insights were then validated by primary participants.
Based on additional insights from these primary participants, more directional efforts were put into doing secondary research and optimize data models. This process was repeated till all data models used in the study produced similar results (with minimum deviation). This way, this iterative process was able to generate the most accurate market numbers and qualitative insights.
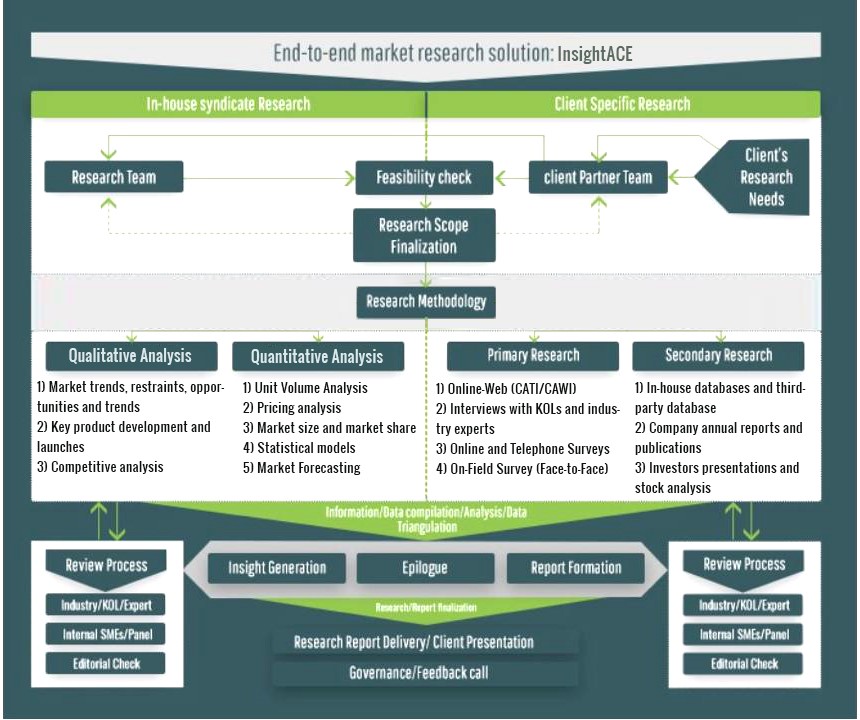
Secondary research
The secondary research sources that are typically mentioned to include, but are not limited to:
The paid sources for secondary research like Factiva, OneSource, Hoovers, and Statista
Primary Research:
Primary research involves telephonic interviews, e-mail interactions, as well as face-to-face interviews for each market, category, segment, and subsegment across geographies
The contributors who typically take part in such a course include, but are not limited to:
Data Modeling and Analysis:
In the iterative process (mentioned above), data models received inputs from primary as well as secondary sources. But analysts working on these models were the key. They used their extensive knowledge and experience about industry and topic to make changes and fine-tuning these models as per the product/service under study.
The standard data models used while studying this market were the top-down and bottom-up approaches and the company shares analysis model. However, other methods were also used along with these – which were specific to the industry and product/service under study.
