
The Non-GMO Flour Market Size is valued at USD 27.7 Bn in 2023 and is predicted to reach USD 37.2 Bn by the year 2031 at an 3.9% CAGR during the forecast period for 2024-2031.

Non-GMO flour is made from traditional types of wheat, corn, or other grains grown without genetically modified seeds, ensuring that it contains no genetically modified organisms (GMOs). GMOs are plants or animals whose DNA has been altered through biotechnology to improve crop yields or enhance insect resistance.
Consumers often choose non-GMO flour due to concerns about the environmental, health, and ethical impacts of GMOs. While organic certification follows a different standard, some individuals prefer non-GMO products as they are more likely to align with organic farming practices. Non-GMO flour is often seen as a healthier option because it avoids genetic modification, which may appeal to consumers focused on natural and minimally processed foods. It also appeals to consumers looking for more natural or less-processed baking ingredients, as it is viewed as a healthier option. Additionally, non-GMO flour plays a significant role in whole-food, plant-based diets by supporting a minimally processed and natural food philosophy.
Many producers are adopting regenerative farming practices to improve soil health, reduce carbon emissions, and enhance biodiversity, resulting in higher-quality, more nutrient-dense grains. At the same time, the use of digitization to boost brand and name recognition is a growing trend in the industry. However, smaller companies with limited marketing budgets may not be able to compete with larger corporations in terms of promotional efforts. In such cases, they can collaborate with well-known brands or create eye-catching strategies to gain free publicity, such as promoting climate action by encouraging customers to recycle bottles and informing local and national media about their initiatives. To expand their consumer base, share costs, and promote their brand and products, companies can also enter into cooperative marketing agreements.
Additionally, non-GMO food producers are driving the global non-GMO food industry by using smart labeling to make product data more accessible and employing unique packaging to attract and engage consumers. The growth of the non-GMO sector is further supported by organizations dedicated to product safety, quality, and transparent labeling that reflect the values of global consumers. Shifting consumer preferences toward healthier options is also contributing to the market’s expansion.
The non-GMO flour market is segmented based on product type, distribution channel, and end use, form. Based on the product type, the market is divided into wheat flour, corn flour, rice flour, and almond flour. Based on the distribution channel, the market is divided into online retail, supermarkets, health food stores, and wholesale. Based on the end use, the market is divided into baking, cooking, brewing, and snacking. Based on the form, the market is divided into whole grain, refined, and coarse.
Based on the product type, the market is divided into wheat flour, corn flour, rice flour, and almond flour. Among these, the wheat flour segment is expected to have the highest growth rate during the forecast period. Wheat flour is a fundamental ingredient in a wide variety of everyday food products, such as bread, pasta, pastries, and baked goods. These products are consumed globally, making wheat flour one of the most widely used and in-demand flour in the world. Many consumers prioritize non-GMO products for their health and environmental benefits. Since wheat flour is a staple in many households, the demand for non-GMO wheat flour has grown in response to this shift toward natural, less-processed, and ethically produced ingredients. Non-GMO wheat flour aligns with organic, clean-label, and minimally processed food trends. Consumers looking for healthier, environmentally friendly, and ethically sourced products are more likely to choose non-GMO wheat flour. This growing preference fuels market demand.
Based on the end use, the market is divided into baking, cooking, brewing, and snacking. Baking uses the highest volume of flour, especially wheat flour, in producing essential food products like bread, cakes, pastries, and other baked goods. Bread, in particular, is a staple food in many parts of the world, and there is increasing demand for Non-GMO ingredients in bread production due to consumer preferences for healthier, more natural products.
Consumers seeking non-GMO options often turn to baked goods as part of their everyday diet, including bread, muffins, cookies, and cakes. Many bakeries and food manufacturers have responded by offering non-GMO versions of their products to cater to this demand, driving the flour market. Non-GMO flour is used in both commercial baking industries and home baking, making it a versatile and high-demand ingredient. With the rise of clean-label and organic trends, consumers prefer using non-GMO flour for homemade baking, further boosting the market.
North America has a highly developed market for organic, natural, and specialty foods. Many organic food products are also non-GMO, which boosts the demand for non-GMO flour in organic bread, pasta, snacks, and baked goods. Several large food manufacturers and retailers in North America focus on offering non-GMO products to cater to consumer preferences. Major companies in the region, along with a growing number of startups, are producing and promoting non-GMO flour to meet market demand. The rising trends in home baking, especially during times like the COVID-19 pandemic, also contributed to the significant consumption of non-GMO flour in this region.
|
Report Attribute |
Specifications |
|
Market Size Value In 2023 |
USD 27.7 Bn |
|
Revenue Forecast In 2031 |
USD 37.2 Bn |
|
Growth Rate CAGR |
CAGR of 3.9% from 2024 to 2031 |
|
Quantitative Units |
Representation of revenue in US$ Bn and CAGR from 2024 to 2031 |
|
Historic Year |
2019 to 2023 |
|
Forecast Year |
2024-2031 |
|
Report Coverage |
The forecast of revenue, the position of the company, the competitive market structure, growth prospects, and trends |
|
Segments Covered |
By Product Type, Distribution Channel, End Use, and Form |
|
Regional Scope |
North America; Europe; Asia Pacific; Latin America; Middle East & Africa |
|
Country Scope |
U.S.; Canada; U.K.; Germany; China; India; Japan; Brazil; Mexico; France; Italy; Spain; South Korea; South East Asia |
|
Competitive Landscape |
Munkebo, Cargill, Incorporated, Bunge Limited, King Arthur Baking Company, Sankalp Quality Foods, Doves Farm, Healthy Grain, Bob's Red Mill, Natural Foods, Grain Millers, Inc., Pillsbury Company, White Lily, Annie's Homegrown, General Mills, Inc., Hodgson Mill, Archer Daniels Midland Company, Organic Valley, Hain Celestial, Amy’s Kitchen, United Natural Foods, Chiquita Brands, Eden Foods, Shanghai Food, Alberts Organics |
|
Customization Scope |
Free customization report with the procurement of the report and modifications to the regional and segment scope. Particular Geographic competitive landscape. |
|
Pricing and Available Payment Methods |
Explore pricing alternatives that are customized to your particular study requirements. |
Chapter 1. Methodology and Scope
1.1. Research Methodology
1.2. Research Scope & Assumptions
Chapter 2. Executive Summary
Chapter 3. Global Non-GMO Flour Market Snapshot
Chapter 4. Global Non-GMO Flour Market Variables, Trends & Scope
4.1. Market Segmentation & Scope
4.2. Drivers
4.3. Challenges
4.4. Trends
4.5. Investment and Funding Analysis
4.6. Porter's Five Forces Analysis
4.7. Incremental Opportunity Analysis (US$ MN), 2024-2031
4.8. Global Non-GMO Flour Market Penetration & Growth Prospect Mapping (US$ Mn), 2023-2031
4.9. Competitive Landscape & Market Share Analysis, By Key Player (2023)
4.10. Use/impact of AI on Non-GMO Flour Industry Trends
Chapter 5. Non-GMO Flour Market Segmentation 1: By Product Type, Estimates & Trend Analysis
5.1. Market Share by Product Type, 2023 & 2031
5.2. Market Size (Value US$ Mn) & Forecasts and Trend Analyses, 2019 to 2031 for the following Product Type:
5.2.1. Wheat Flour
5.2.2. Corn Flour
5.2.3. Rice Flour
5.2.4. Almond Flour
Chapter 6. Non-GMO Flour Market Segmentation 2: By Distribution Channels, Estimates & Trend Analysis
6.1. Market Share by Distribution Channel, 2023 & 2031
6.2. Market Size (Value US$ Mn) & Forecasts and Trend Analyses, 2019 to 2031 for the following Distribution Channels:
6.2.1. Online Retail
6.2.2. Supermarkets
6.2.3. Health Food Stores
6.2.4. Wholesale
Chapter 7. Non-GMO Flour Market Segmentation 3: By Form, Estimates & Trend Analysis
7.1. Market Share by Form, 2023 & 2031
7.2. Market Size (Value US$ Mn) & Forecasts and Trend Analyses, 2019 to 2031 for the following Forms:
7.2.1. Whole Grain
7.2.2. Refined
7.2.3. Coarse
Chapter 8. Non-GMO Flour Market Segmentation 4: By End Use, Estimates & Trend Analysis
8.1. Market Share by End Use, 2023 & 2031
8.2. Market Size (Value US$ Mn) & Forecasts and Trend Analyses, 2019 to 2031 for the following End Uses:
8.2.1. Baking
8.2.2. Cooking
8.2.3. Brewing
8.2.4. Snacking
Chapter 9. Non-GMO Flour Market Segmentation 5: Regional Estimates & Trend Analysis
9.1. Global Non-GMO Flour Market, Regional Snapshot 2023 & 2031
9.2. North America
9.2.1. North America Non-GMO Flour Market Revenue (US$ Million) Estimates and Forecasts by Country, 2024-2031
9.2.1.1. US
9.2.1.2. Canada
9.2.2. North America Non-GMO Flour Market Revenue (US$ Million) Estimates and Forecasts by Product Type, 2024-2031
9.2.3. North America Non-GMO Flour Market Revenue (US$ Million) Estimates and Forecasts by Distribution Channel, 2024-2031
9.2.4. North America Non-GMO Flour Market Revenue (US$ Million) Estimates and Forecasts by Form, 2024-2031
9.2.5. North America Non-GMO Flour Market Revenue (US$ Million) Estimates and Forecasts by End Use, 2024-2031
9.3. Europe
9.3.1. Europe Non-GMO Flour Market Revenue (US$ Million) Estimates and Forecasts by Country, 2024-2031
9.3.1.1. Germany
9.3.1.2. U.K.
9.3.1.3. France
9.3.1.4. Italy
9.3.1.5. Spain
9.3.1.6. Rest of Europe
9.3.2. Europe Non-GMO Flour Market Revenue (US$ Million) Estimates and Forecasts by Product Type, 2024-2031
9.3.3. Europe Non-GMO Flour Market Revenue (US$ Million) Estimates and Forecasts by Distribution Channel, 2024-2031
9.3.4. Europe Non-GMO Flour Market Revenue (US$ Million) Estimates and Forecasts by Form, 2024-2031
9.3.5. Europe Non-GMO Flour Market Revenue (US$ Million) Estimates and Forecasts by End Use, 2024-2031
9.4. Asia Pacific
9.4.1. Asia Pacific Non-GMO Flour Market Revenue (US$ Million) Estimates and Forecasts by Country, 2024-2031
9.4.1.1. India
9.4.1.2. China
9.4.1.3. Japan
9.4.1.4. Australia
9.4.1.5. South Korea
9.4.1.6. Hong Kong
9.4.1.7. Southeast Asia
9.4.1.8. Rest of Asia Pacific
9.4.2. Asia Pacific Non-GMO Flour Market Revenue (US$ Million) Estimates and Forecasts by Product Type, 2024-2031
9.4.3. Asia Pacific Non-GMO Flour Market Revenue (US$ Million) Estimates and Forecasts by Distribution Channel, 2024-2031
9.4.4. Asia Pacific Non-GMO Flour Market Revenue (US$ Million) Estimates and Forecasts By Form, 2024-2031
9.4.5. Asia Pacific Non-GMO Flour Market Revenue (US$ Million) Estimates and Forecasts by End Use, 2024-2031
9.5. Latin America
9.5.1. Latin America Non-GMO Flour Market Revenue (US$ Million) Estimates and Forecasts by Country, 2024-2031
9.5.1.1. Brazil
9.5.1.2. Mexico
9.5.1.3. Rest of Latin America
9.5.2. Latin America Non-GMO Flour Market Revenue (US$ Million) Estimates and Forecasts by Product Type, 2024-2031
9.5.3. Latin America Non-GMO Flour Market Revenue (US$ Million) Estimates and Forecasts by Distribution Channel, 2024-2031
9.5.4. Latin America Non-GMO Flour Market Revenue (US$ Million) Estimates and Forecasts by Form, 2024-2031
9.5.5. Latin America Non-GMO Flour Market Revenue (US$ Million) Estimates and Forecasts by End Use, 2024-2031
9.6. Middle East & Africa
9.6.1. Middle East & Africa Non-GMO Flour Market Revenue (US$ Million) Estimates and Forecasts by country, 2024-2031
9.6.1.1. GCC Countries
9.6.1.2. Israel
9.6.1.3. South Africa
9.6.1.4. Rest of Middle East and Africa
9.6.2. Middle East & Africa Non-GMO Flour Market Revenue (US$ Million) Estimates and Forecasts by Product Type, 2024-2031
9.6.3. Middle East & Africa Non-GMO Flour Market Revenue (US$ Million) Estimates and Forecasts by Distribution Channel, 2024-2031
9.6.4. Middle East & Africa Non-GMO Flour Market Revenue (US$ Million) Estimates and Forecasts by Form, 2024-2031
9.6.5. Middle East & Africa Non-GMO Flour Market Revenue (US$ Million) Estimates and Forecasts by End Use, 2024-2031
Chapter 10. Competitive Landscape
10.1. Major Mergers and Acquisitions/Strategic Alliances
10.2. Company Profiles
10.2.1. Munkebo
10.2.1.1. Business Overview
10.2.1.2. Key Product/Service Offerings
10.2.1.3. Financial PerProduct Typeance
10.2.1.4. Geographical Presence
10.2.1.5. Recent Developments with Business Strategy
10.2.2. Cargill, Incorporated
10.2.3. Bunge Limited
10.2.4. King Arthur Baking Company
10.2.5. Sankalp Quality Foods
10.2.6. Doves Farm
10.2.7. Healthy Grain
10.2.8. Bob's Red Mill Natural Foods
10.2.9. Grain Millers, Inc.
10.2.10. Pillsbury Company
10.2.11. White Lily
10.2.12. Annie's Homegrown
10.2.13. General Mills, Inc.
10.2.14. Hodgson Mill
10.2.15. Archer Daniels Midland Company
10.2.16. Organic Valley
10.2.17. Hain Celestial
10.2.18. Amy’s kitchen
10.2.19. United Natural Foods
10.2.20. Chiquita Brands
10.2.21. Eden Foods
10.2.22. Shanghai Food
10.2.23. Alberts Organics
10.2.24. Other Market Playres
Global Non-GMO Flour Market- By Product Type

Global Non-GMO Flour Market – By Distribution Channel
Global Non-GMO Flour Market – By End Use
Global Non-GMO Flour Market – By Form
Global Non-GMO Flour Market – By Region
North America-
Europe-
Asia-Pacific-
Latin America-
Middle East & Africa-
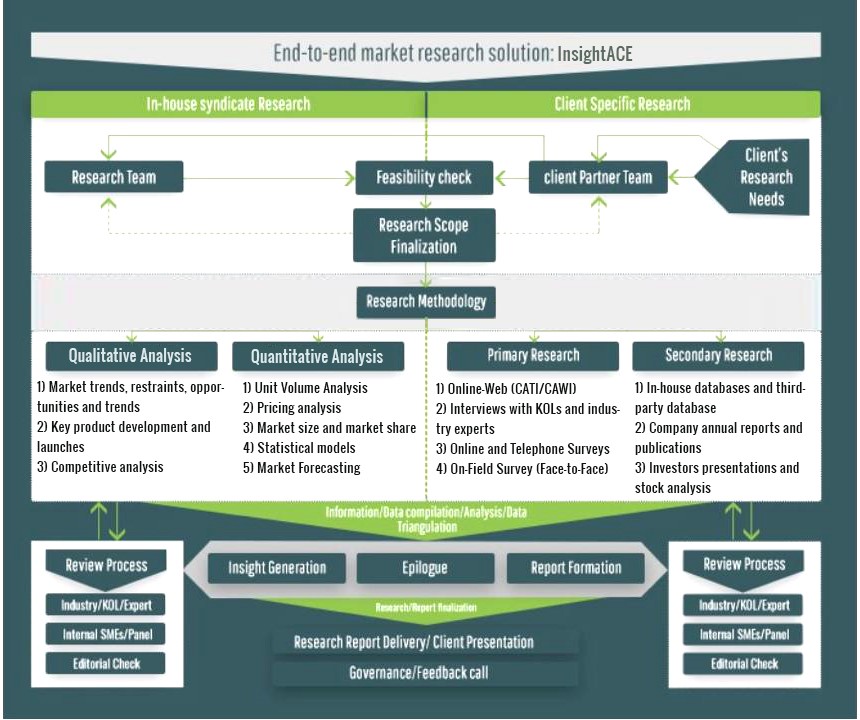
InsightAce Analytic follows a standard and comprehensive market research methodology focused on offering the most accurate and precise market insights. The methods followed for all our market research studies include three significant steps – primary research, secondary research, and data modeling and analysis - to derive the current market size and forecast it over the forecast period. In this study, these three steps were used iteratively to generate valid data points (minimum deviation), which were cross-validated through multiple approaches mentioned below in the data modeling section.
Through secondary research methods, information on the market under study, its peer, and the parent market was collected. This information was then entered into data models. The resulted data points and insights were then validated by primary participants.
Based on additional insights from these primary participants, more directional efforts were put into doing secondary research and optimize data models. This process was repeated till all data models used in the study produced similar results (with minimum deviation). This way, this iterative process was able to generate the most accurate market numbers and qualitative insights.
Secondary research
The secondary research sources that are typically mentioned to include, but are not limited to:
The paid sources for secondary research like Factiva, OneSource, Hoovers, and Statista
Primary Research:
Primary research involves telephonic interviews, e-mail interactions, as well as face-to-face interviews for each market, category, segment, and subsegment across geographies
The contributors who typically take part in such a course include, but are not limited to:
Data Modeling and Analysis:
In the iterative process (mentioned above), data models received inputs from primary as well as secondary sources. But analysts working on these models were the key. They used their extensive knowledge and experience about industry and topic to make changes and fine-tuning these models as per the product/service under study.
The standard data models used while studying this market were the top-down and bottom-up approaches and the company shares analysis model. However, other methods were also used along with these – which were specific to the industry and product/service under study.
