79.JPG)
The Global Lignans Market Size is valued at USD 442.11 Million in 2023 and is predicted to reach USD 818.75 Million by the year 2031 at an 8.18% CAGR during the forecast period for 2024-2031.
Key Industry Insights & Findings from the Report:

Phenylpropanoid dimers called lignans are made up of two phenyl propane units joined by their C8 central carbons. These compounds are widely distributed throughout plants and are typically found in the stem, bark, root, fruits, and seed sections. Sesame, flax, pumpkin, sunflower, wheat, corn, broccoli, strawberries, and peas are the main sources of lignans.
The increased use of cereal-based goods including muesli, oatmeal, raisin bran, and compressed puffed rice is the main reason driving the growth of the lignans industry. The growing use of lignans to add antioxidant and oestrogen properties to foods like energy bars, cereals, whole-grain bread, crackers, semolina pasta, vegetarian dinners, and other snack foods is the main reason fueling demand for lignans. In addition, the market for lignans is expected to have increased demand due to rising health concerns, a growing animal feed business, and a robust pharmaceutical sector.
The market for lignans is also expanding as a result of factors such as increased disposable income, technological advancements, shifting demographics and lifestyles, and several encouraging research findings. A potential obstacle to the growth of the lignans market is the lack of consumer product awareness. On the other hand, the regulations and taxes on lignan production imposed by various governments in various regions are expected to act as a restraint.
The lignans market is segmented on the source, application and distribution channel. Based on source, the market is segmented into oilseeds, cereals, plant resins, fruits and others. Based on application, lignans market is segmented into food, cosmetic, pharmaceutical, animal feed and others. Based on distibution channel, lignans market is segmented into offline and online.
The cereals category grabbed the highest revenue share, and it is anticipated that they will continue to hold that position during the anticipated time. Lignans obtained from cereals and whole grains, such as rye, barley, wheat, corn, and oats, exhibit anti-inflammatory, antioxidant, and hormone-mimicking properties in people following fermentative conversion, as well as after as a native compound in the colon. The expansion of the cereals- and grains-based lignans is projected to be aided by the rising usage of natural components in cosmetics and toiletry products.
The food category is anticipated to grow at a significant rate over the forecast period ascribed to the expanding fashion industry globally. Functional foods have a significant role in preventive healthcare by lowering the risk of diseases by boosting the immune system. The market is projected to be driven by consumers' shifting preferences for preventative healthcare as a result of increased disposable income levels.
The Asia Pacific lignans market is expected to register the highest market share in revenue in the near future. The two main elements promoting industry growth in the area are new product developments and fortification requirements from the government. Consumption of functional food items has increased as a result of a growing preference for foods that are not only nutrient-dense but also have the potential to enhance general health and wellbeing. In addition, the North America is projected to grow at a rapid rate in the global lignans market. The region's functional food industry has expanded quickly as a result of the rising working-class population in North America. People in the area mainly eat functional meals to manage their weight. Market expansion has been aided by increased investments from major multinational corporations in North America and the launch of new products to satisfy escalating demand.
|
Report Attribute |
Specifications |
|
Market size value in 2023 |
USD 442.11 Mn |
|
Revenue forecast in 2031 |
USD 818.75 Mn |
|
Growth rate CAGR |
CAGR of 8.18% from 2024 to 2031 |
|
Quantitative units |
Representation of revenue in US$ Million, and CAGR from 2024 to 2031 |
|
Historic Year |
2019 to 2023 |
|
Forecast Year |
2024-2031 |
|
Report coverage |
The forecast of revenue, the position of the company, the competitive market structure, growth prospects, and trends |
|
Segments covered |
Source, Application And Distribution Channel |
|
Regional scope |
North America; Europe; Asia Pacific; Latin America; Middle East & Africa |
|
Country scope |
U.S.; Canada; U.K.; Germany; China; India; Japan; Brazil; Mexico; The UK; France; Italy; Spain; China; Japan; India; South Korea; Southeast Asia; South Korea; Southeast Asia |
|
Competitive Landscape |
BioGin Biochemicals Co. Ltd., Hunan Nutramax Inc., Naturalin Bio-Resources Co. Ltd, Shaanxi Zebrago Industrial Co. Limited, Xian Lyphar Biotech Co. Ltd., Kingherbs Hanzhong Penghong Tianyi Biotech Co. Ltd., Hebei Xinqidian Biotechnology Co. Ltd, Skuny Bioscience Co. Ltd., TSKG Products LLC, Ipsen, Meiherb Biotech Co. Ltd., Ningbo United Plant Technology Co. Ltd., Zebrago Herb, Caldic Canada Inc., Archer Daniels Midland Company, and Kingherbs Limited. |
|
Customization scope |
Free customization report with the procurement of the report, Modifications to the regional and segment scope. Particular Geographic competitive landscape. |
|
Pricing and available payment methods |
Explore pricing alternatives that are customized to your particular study requirements. |
Chapter 1. Methodology and Scope
1.1. Research Methodology
1.2. Research Scope & Assumptions
Chapter 2. Executive Summary
Chapter 3. Global Lignans Market Snapshot
Chapter 4. Global Lignans Market Variables, Trends & Scope
4.1. Market Segmentation & Scope
4.2. Drivers
4.3. Challenges
4.4. Trends
4.5. Investment and Funding Analysis
4.6. Industry Analysis – Porter’s Five Forces Analysis
4.7. Competitive Landscape & Market Share Analysis
4.8. Impact of Covid-19 Analysis
Chapter 5. Market Segmentation 1: by Source Estimates & Trend Analysis
5.1. by Source & Market Share, 2019 & 2031
5.2. Market Size (Value (US$ Mn)) & Forecasts and Trend Analyses, 2019 to 2031 for the following by Source:
5.2.1. Oilseeds
5.2.2. Cereals
5.2.3. Plant resins
5.2.4. Fruits
5.2.5. Others
Chapter 6. Market Segmentation 2: by Application Estimates & Trend Analysis
6.1. by Application & Market Share, 2019 & 2031
6.2. Market Size (Value (US$ Mn)) & Forecasts and Trend Analyses, 2019 to 2031 for the following by Application:
6.2.1. Food
6.2.2. Cosmetic
6.2.3. Pharmaceutical
6.2.4. Animal Feed
6.2.5. Others
Chapter 7. Market Segmentation 3: by Distribution Channel Estimates & Trend Analysis
7.1. by Distribution Channel & Market Share, 2019 & 2031
7.2. Market Size (Value (US$ Mn)) & Forecasts and Trend Analyses, 2019 to 2031 for the following by Distribution Channel:
7.2.1. Offline Channel
7.2.2. Online Channel
Chapter 8. Lignans Market Segmentation 4: Regional Estimates & Trend Analysis
8.1. North America
8.1.1. North America Lignans Market Revenue (US$ Million) Estimates and Forecasts by Source, 2024-2031
8.1.2. North America Lignans Market Revenue (US$ Million) Estimates and Forecasts by Application, 2024-2031
8.1.3. North America Lignans Market Revenue (US$ Million) Estimates and Forecasts by Distribution Channel, 2024-2031
8.1.4. North America Lignans Market Revenue (US$ Million) Estimates and Forecasts by country, 2024-2031
8.2. Europe
8.2.1. Europe Lignans Market Revenue (US$ Million) Estimates and Forecasts by Source, 2024-2031
8.2.2. Europe Lignans Market Revenue (US$ Million) Estimates and Forecasts by Application, 2024-2031
8.2.3. Europe Lignans Market Revenue (US$ Million) Estimates and Forecasts by Distribution Channel, 2024-2031
8.2.4. Europe Lignans Market Revenue (US$ Million) Estimates and Forecasts by country, 2024-2031
8.3. Asia Pacific
8.3.1. Asia Pacific Lignans Market Revenue (US$ Million) Estimates and Forecasts by Source, 2024-2031
8.3.2. Asia Pacific Lignans Market Revenue (US$ Million) Estimates and Forecasts by Application, 2024-2031
8.3.3. Asia-Pacific Lignans Market Revenue (US$ Million) Estimates and Forecasts by Distribution Channel, 2024-2031
8.3.4. Asia Pacific Lignans Market Revenue (US$ Million) Estimates and Forecasts by country, 2024-2031
8.4. Latin America
8.4.1. Latin America Lignans Market Revenue (US$ Million) Estimates and Forecasts by Source, 2024-2031
8.4.2. Latin America Lignans Market Revenue (US$ Million) Estimates and Forecasts by Application, 2024-2031
8.4.3. Latin America Lignans Market Revenue (US$ Million) Estimates and Forecasts by Distribution Channel, 2024-2031
8.4.4. Latin America Lignans Market Revenue (US$ Million) Estimates and Forecasts by country, 2024-2031
8.5. Middle East & Africa
8.5.1. Middle East & Africa Lignans Market Revenue (US$ Million) Estimates and Forecasts by Source, 2024-2031
8.5.2. Middle East & Africa Lignans Market Revenue (US$ Million) Estimates and Forecasts by Application, 2024-2031
8.5.3. Middle East & Africa Lignans Market Revenue (US$ Million) Estimates and Forecasts by Distribution Channel, 2024-2031
8.5.4. Middle East & Africa Lignans Market Revenue (US$ Million) Estimates and Forecasts by country, 2024-2031
Chapter 9. Competitive Landscape
9.1. Major Mergers and Acquisitions/Strategic Alliances
9.2. Company Profiles
9.2.1. Archer Daniels Midland Company
9.2.2. BioGin Biochemicals Co. Ltd.
9.2.3. Caldic Canada Inc.
9.2.4. FarmaSino Pharmaceuticals (Jiangsu) Co., Ltd.
9.2.5. Hebei Xinqidian Biotechnology Co., Ltd.
9.2.6. Hunan Nutramax Inc.
9.2.7. Kingherbs Hanzhong Penghong Tianyi Biotech Co. Ltd.
9.2.8. Meiherb Biotech Co. Ltd.
9.2.9. Naturalin Bio-Resources Co. Ltd
9.2.10. Ningbo United Plant Technology Co. Ltd.
9.2.11. Plamed Green Science Group
9.2.12. Prairie Tide Diversified, Inc.
9.2.13. Shaanxi Zebrago Industrial Co., Ltd.
9.2.14. Skuny Bioscience Co. Ltd.
9.2.15. SPI Pharma
9.2.16. TSKG Products, LLC
9.2.17. Xi'an Sinuotebio Tech Co. Ltd.
9.2.18. Zebrago Herb
9.2.19. Other Prominent Players
Lignans Market By Source

Lignans Market By Application
Lignans Market By Distribution Channel
By Region-
North America-
Europe-
Asia-Pacific-
Latin America-
Middle East & Africa-
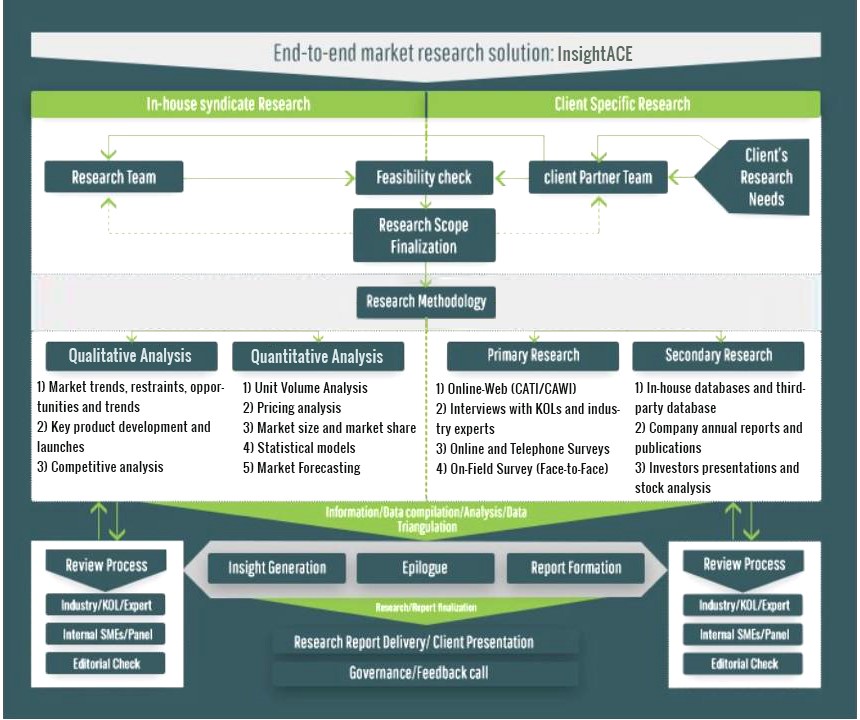
InsightAce Analytic follows a standard and comprehensive market research methodology focused on offering the most accurate and precise market insights. The methods followed for all our market research studies include three significant steps – primary research, secondary research, and data modeling and analysis - to derive the current market size and forecast it over the forecast period. In this study, these three steps were used iteratively to generate valid data points (minimum deviation), which were cross-validated through multiple approaches mentioned below in the data modeling section.
Through secondary research methods, information on the market under study, its peer, and the parent market was collected. This information was then entered into data models. The resulted data points and insights were then validated by primary participants.
Based on additional insights from these primary participants, more directional efforts were put into doing secondary research and optimize data models. This process was repeated till all data models used in the study produced similar results (with minimum deviation). This way, this iterative process was able to generate the most accurate market numbers and qualitative insights.
Secondary research
The secondary research sources that are typically mentioned to include, but are not limited to:
The paid sources for secondary research like Factiva, OneSource, Hoovers, and Statista
Primary Research:
Primary research involves telephonic interviews, e-mail interactions, as well as face-to-face interviews for each market, category, segment, and subsegment across geographies
The contributors who typically take part in such a course include, but are not limited to:
Data Modeling and Analysis:
In the iterative process (mentioned above), data models received inputs from primary as well as secondary sources. But analysts working on these models were the key. They used their extensive knowledge and experience about industry and topic to make changes and fine-tuning these models as per the product/service under study.
The standard data models used while studying this market were the top-down and bottom-up approaches and the company shares analysis model. However, other methods were also used along with these – which were specific to the industry and product/service under study.
To know more about the research methodology used for this study, kindly contact us/click here.
