
The Hydrogen Valve Market Size is valued at USD 306.2 million in 2023 and is predicted to reach USD 513.2 million by the year 2031 at a 6.9% CAGR during the forecast period for 2024-2031.

A hydrogen valve is an instrument specifically engineered to regulate the movement of hydrogen liquid or gas in a variety of systems. Industries such as energy, automotive, and industrial applications rely on these valves to regulate and handle hydrogen safely. The market growth of hydrogen valves is being propelled by the development of technologically superior valves that can endure high pressures while maintaining safety, which is the primary driver of the hydrogen valve market. With these upgrades, valves are more suited for vital hydrogen uses in the energy, automotive, and industrial sectors, owing to their increased dependability, efficiency, and leak avoidance. Additionally, rising demand for hydrogen in ammonia production and widespread acceptance of hydrogen as a clean energy source are fueling explosive expansion in the worldwide market for hydrogen valves. Moreover, hydrogen valve infrastructure is encouraged by supportive policies and incentives.
However, the high costs of a hydrogen valve, complex valve technology, materials needed for hydrogen uses are expensive, and strict safety rules regarding hydrogen, which limit the market growth. Additionally, because of the pandemic's effects on industrial activity, supply chain interruptions, and project delays, the hydrogen valve market was severely impacted. Additionally, demand for infrastructure related to hydrogen has been driven by a resurgence following the pandemic and a renewed emphasis on sustainable energy efforts. Furthermore, the market for valves has enormous potential due to the rising use of hydrogen fuel cell systems.
The hydrogen valve market is segmented based on valve type, material, pressure range, size, implementation type, application, and end-use industry. The valve type segment comprises needle valves, ball valves, check valves, pressure relief valves, globe valves, flow control valves, and others. According to the material segment, the market is segmented into stainless steel, aluminium, and others. By pressure range, the market is segmented into up to 50 bars, 50-350 bars, 350-700 bars, 700-1500, and more than 1500 bars. By size, the market is segmented into below 1 inch, 1-6 inch, 6-12 inch, 12-20 inch, and more than 20 inch. By implementation type, the market is segmented into new installation and retrofit installation. The application segment includes hydrogen production, hydrogen fueling stations, hydrogen storage, hydrogen transportation, and hydrogen fuel cells. As per end-use industry, the market is segmented into oil & gas, energy & power, pharmaceutical, chemical, metals & mining, food & beverage, automotive, and others.
Ball valves are expected to hold a major global market share in 2023 in the hydrogen valve market because they are long-lasting, can handle high pressure, and can make a tight seal, which is very important for hydrogen uses. Because of their flexible design, they can effectively control flow, have low leakage, and be reliable over time. This makes them perfect for managing hydrogen valves safely and effectively in many industries, such as the energy, automobile, and chemical sectors.
The hydrogen storage segment is growing because hydrogen is becoming increasingly significant in renewable energy programs, and there is a growing need for safe and effective storage solutions. Hydrogen valve solutions that guarantee secure containment and control of hydrogen are becoming increasingly important due to increasing expenditures in hydrogen infrastructure and the necessity for dependable storage systems in the transportation, energy, and industrial sectors. Consequently, this industry is experiencing significant expansion.
The North American hydrogen valve market is predicted to note the highest market share in revenue in the near future. This can be attributed to the region's important businesses, such as energy and automotive, its growing government backing for hydrogen projects, and its emphasis on sustainable energy efforts. Another factor propelling demand for hydrogen valves is the improvement of hydrogen storage and infrastructure. In addition, the Asia Pacific is expected to grow rapidly in the hydrogen valve market because of rising expenditures on clean energy, an expanding hydrogen infrastructure, and rising industrial demand. As a result, hydrogen valve technology is being adopted at a rapid pace.
|
Report Attribute |
Specifications |
|
Market Size Value In 2023 |
USD 306.2 Mn |
|
Revenue Forecast In 2031 |
USD 513.2 Mn |
|
Growth Rate CAGR |
CAGR of 6.9% from 2024 to 2031 |
|
Quantitative Units |
Representation of revenue in US$ Mn and CAGR from 2024 to 2031 |
|
Historic Year |
2019 to 2023 |
|
Forecast Year |
2024-2031 |
|
Report Coverage |
The forecast of revenue, the position of the company, the competitive market structure, growth prospects, and trends |
|
Segments Covered |
By Valve Type, Material, Pressure Range, Size, Implementation Type, Application, And End-Use Industry |
|
Regional Scope |
North America; Europe; Asia Pacific; Latin America; Middle East & Africa |
|
Country Scope |
U.S.; Canada; U.K.; Germany; China; India; Japan; Brazil; Mexico; France; Italy; Spain; South East Asia; South Korea |
|
Competitive Landscape |
Emerson Electric Co., IMI, SLB, Valmet, Crane Company, Westport Fuel Systems Inc., KITZ Corporation, PARKER HANNIFIN CORP, Baker Hughes Company, Swagelok Company and Other Market Players |
|
Customization Scope |
Free customization report with the procurement of the report and modifications to the regional and segment scope. Particular Geographic competitive landscape. |
|
Pricing And Available Payment Methods |
Explore pricing alternatives that are customized to your particular study requirements. |
Chapter 1. Methodology and Scope
1.1. Research Methodology
1.2. Research Scope & Assumptions
Chapter 2. Executive Summary
Chapter 3. Global Hydrogen Valve Market Snapshot
Chapter 4. Global Hydrogen Valve Market Variables, Trends & Scope
4.1. Market Segmentation & Scope
4.2. Drivers
4.3. Challenges
4.4. Trends
4.5. Investment and Funding Analysis
4.6. Porter's Five Forces Analysis
4.7. Incremental Opportunity Analysis (US$ MN), 2024-2031
4.8. Global Hydrogen Valve Market Penetration & Growth Prospect Mapping (US$ Mn), 2023-2031
4.9. Competitive Landscape & Market Share Analysis, By Key Player (2023)
4.10. Use/impact of AI on Hydrogen Valve Industry Trends
Chapter 5. Hydrogen Valve Market Segmentation 1: By Valve Type, Estimates & Trend Analysis
5.1. Market Share by Valve Type, 2023 & 2031
5.2. Market Size (Value US$ Mn) & Forecasts and Trend Analyses, 2019 to 2031 for the following Valve Type:
5.2.1. Needle Valve
5.2.2. Ball Valve
5.2.3. Check valve
5.2.4. Pressure Relief Valve
5.2.5. Globe Valve
5.2.6. Flow control Valve
5.2.7. Others
Chapter 6. Hydrogen Valve Market Segmentation 2: By Application, Estimates & Trend Analysis
6.1. Market Share by Application, 2023 & 2031
6.2. Market Size (Value US$ Mn) & Forecasts and Trend Analyses, 2019 to 2031 for the following Applications:
6.2.1. Hydrogen Production
6.2.2. Hydrogen Fueling Station
6.2.3. Hydrogen Storage
6.2.4. Hydrogen Transportation
6.2.5. Hydrogen Fuel Cells
Chapter 7. Hydrogen Valve Market Segmentation 3: By Material, Estimates & Trend Analysis
7.1. Market Share by Material, 2023 & 2031
7.2. Market Size (Value US$ Mn) & Forecasts and Trend Analyses, 2019 to 2031 for the following Materials:
7.2.1. Stainless steel
7.2.2. Aluminum
7.2.3. Others
Chapter 8. Hydrogen Valve Market Segmentation 4: By Pressure Range, Estimates & Trend Analysis
8.1. Market Share by Pressure Range, 2023 & 2031
8.2. Market Size (Value US$ Mn) & Forecasts and Trend Analyses, 2019 to 2031 for the following Pressure Ranges:
8.2.1. Upto 50 bar
8.2.2. 50-350 bar
8.2.3. 350-700 bar
8.2.4. 700-1500
8.2.5. More than 1500 bar
Chapter 9. Hydrogen Valve Market Segmentation 5: By Size, Estimates & Trend Analysis
9.1. Market Share by Size, 2023 & 2031
9.2. Market Size (Value US$ Mn) & Forecasts and Trend Analyses, 2019 to 2031 for the following Size:
9.2.1. Below 1 Inch
9.2.2. 1-6 Inch
9.2.3. 6-12 Inch
9.2.4. 12-20 Inch
9.2.5. More than 20 Inch
Chapter 10. Hydrogen Valve Market Segmentation 5: By Implementation Type, Estimates & Trend Analysis
10.1. Market Share by Implementation Type, 2023 & 2031
10.2. Market Size (Value US$ Mn) & Forecasts and Trend Analyses, 2019 to 2031 for the following Implementation Type:
10.2.1. New Installation
10.2.2. Retrofit Installation
Chapter 11. Hydrogen Valve Market Segmentation 5: By End Use Industry, Estimates & Trend Analysis
11.1. Market Share by End Use Industry, 2023 & 2031
11.2. Market Size (Value US$ Mn) & Forecasts and Trend Analyses, 2019 to 2031 for the following End Use Industry
11.2.1. Oil & Gas
11.2.2. Energy & Power
11.2.3. Pharmaceutical
11.2.4. Chemical
11.2.5. Metals & Mining
11.2.6. Food & Beverage
11.2.7. Automotive
11.2.8. Others
Chapter 12. Hydrogen Valve Market Segmentation 6: Regional Estimates & Trend Analysis
12.1. Global Hydrogen Valve Market, Regional Snapshot 2023 & 2031
12.2. North America
12.2.1. North America Hydrogen Valve Market Revenue (US$ Million) Estimates and Forecasts by Country, 2024-2031
12.2.1.1. US
12.2.1.2. Canada
12.2.2. North America Hydrogen Valve Market Revenue (US$ Million) Estimates and Forecasts by Valve Type, 2024-2031
12.2.3. North America Hydrogen Valve Market Revenue (US$ Million) Estimates and Forecasts by Application, 2024-2031
12.2.4. North America Hydrogen Valve Market Revenue (US$ Million) Estimates and Forecasts by Material, 2024-2031
12.2.5. North America Hydrogen Valve Market Revenue (US$ Million) Estimates and Forecasts by Pressure Range, 2024-2031
12.2.6. North America Hydrogen Valve Market Revenue (US$ Million) Estimates and Forecasts by Size, 2024-2031
12.2.7. North America Hydrogen Valve Market Revenue (US$ Million) Estimates and Forecasts by Implementation Type, 2024-2031
12.2.8. North America Hydrogen Valve Market Revenue (US$ Million) Estimates and Forecasts by End Use Industry, 2024-2031
12.3. Europe
12.3.1. Europe Hydrogen Valve Market Revenue (US$ Million) Estimates and Forecasts by Country, 2024-2031
12.3.1.1. Germany
12.3.1.2. U.K.
12.3.1.3. France
12.3.1.4. Italy
12.3.1.5. Spain
12.3.1.6. Rest of Europe
12.3.2. Europe Hydrogen Valve Market Revenue (US$ Million) Estimates and Forecasts by Valve Type, 2024-2031
12.3.3. Europe Hydrogen Valve Market Revenue (US$ Million) Estimates and Forecasts by Application, 2024-2031
12.3.4. Europe Hydrogen Valve Market Revenue (US$ Million) Estimates and Forecasts by Material, 2024-2031
12.3.5. Europe Hydrogen Valve Market Revenue (US$ Million) Estimates and Forecasts by Pressure Range, 2024-2031
12.3.6. Europe Hydrogen Valve Market Revenue (US$ Million) Estimates and Forecasts by Size, 2024-2031
12.3.7. Europe Hydrogen Valve Market Revenue (US$ Million) Estimates and Forecasts by End Use Industry, 2024-2031
12.3.8. Europe Hydrogen Valve Market Revenue (US$ Million) Estimates and Forecasts by Implementation Type, 2024-2031
12.4. Asia Pacific
12.4.1. Asia Pacific Hydrogen Valve Market Revenue (US$ Million) Estimates and Forecasts by Country, 2024-2031
12.4.1.1. India
12.4.1.2. China
12.4.1.3. Japan
12.4.1.4. Australia
12.4.1.5. South Korea
12.4.1.6. Hong Kong
12.4.1.7. Southeast Asia
12.4.1.8. Rest of Asia Pacific
12.4.2. Asia Pacific Hydrogen Valve Market Revenue (US$ Million) Estimates and Forecasts by Valve Type, 2024-2031
12.4.3. Asia Pacific Hydrogen Valve Market Revenue (US$ Million) Estimates and Forecasts by Application, 2024-2031
12.4.4. Asia Pacific Hydrogen Valve Market Revenue (US$ Million) Estimates and Forecasts By Material, 2024-2031
12.4.5. Asia Pacific Hydrogen Valve Market Revenue (US$ Million) Estimates and Forecasts by Pressure Range, 2024-2031
12.4.6. Asia Pacific Hydrogen Valve Market Revenue (US$ Million) Estimates and Forecasts By Size, 2024-2031
12.4.7. Asia Pacific Hydrogen Valve Market Revenue (US$ Million) Estimates and Forecasts by Implementation Type, 2024-2031
12.4.8. Asia Pacific Hydrogen Valve Market Revenue (US$ Million) Estimates and Forecasts by End Use Industry, 2024-2031
12.5. Latin America
12.5.1. Latin America Hydrogen Valve Market Revenue (US$ Million) Estimates and Forecasts by Country, 2024-2031
12.5.1.1. Brazil
12.5.1.2. Mexico
12.5.1.3. Rest of Latin America
12.5.2. Latin America Hydrogen Valve Market Revenue (US$ Million) Estimates and Forecasts by Valve Type, 2024-2031
12.5.3. Latin America Hydrogen Valve Market Revenue (US$ Million) Estimates and Forecasts by Application, 2024-2031
12.5.4. Latin America Hydrogen Valve Market Revenue (US$ Million) Estimates and Forecasts by Material, 2024-2031
12.5.5. Latin America Hydrogen Valve Market Revenue (US$ Million) Estimates and Forecasts by Pressure Range, 2024-2031
12.5.6. Latin America Hydrogen Valve Market Revenue (US$ Million) Estimates and Forecasts by Size, 2024-2031
12.5.7. Latin America Hydrogen Valve Market Revenue (US$ Million) Estimates and Forecasts by Implementation Type, 2024-2031
12.5.8. Latin America Hydrogen Valve Market Revenue (US$ Million) Estimates and Forecasts by End Use Industry, 2024-2031
Middle East & Africa
12.5.9. Middle East & Africa Hydrogen Valve Market Revenue (US$ Million) Estimates and Forecasts by country, 2024-2031
12.5.9.1. GCC Countries
12.5.9.2. Israel
12.5.9.3. South Africa
12.5.9.4. Rest of Middle East and Africa
12.5.10. Middle East & Africa Hydrogen Valve Market Revenue (US$ Million) Estimates and Forecasts by Valve Type, 2024-2031
12.5.11. Middle East & Africa Hydrogen Valve Market Revenue (US$ Million) Estimates and Forecasts by application, 2024-2031
12.5.12. Middle East & Africa Hydrogen Valve Market Revenue (US$ Million) Estimates and Forecasts by Material, 2024-2031
12.5.13. Middle East & Africa Hydrogen Valve Market Revenue (US$ Million) Estimates and Forecasts by Pressure Range, 2024-2031
12.5.14. Middle East & Africa Hydrogen Valve Market Revenue (US$ Million) Estimates and Forecasts by Size, 2024-2031
12.5.15. Middle East & Africa Hydrogen Valve Market Revenue (US$ Million) Estimates and Forecasts by Implementation Type, 2024-2031
12.5.16. Middle East & Africa Hydrogen Valve Market Revenue (US$ Million) Estimates and Forecasts by End Use Industry, 2024-2031
Chapter 13. Competitive Landscape
13.1. Major Mergers and Acquisitions/Strategic Alliances
13.2. Company Profiles
13.2.1. EMERSON ELECTRIC CO.
13.2.1.1. Business Overview
13.2.1.2. Key Product/Service Valve Types
13.2.1.3. Financial Performance
13.2.1.4. Geographical Presence
13.2.1.5. Recent Developments with Business Strategy
13.2.2. SLB
13.2.3. VALMET
13.2.4. IMI
13.2.5. CRANE COMPANY
13.2.6. PARKER HANNIFIN CORP
13.2.7. BAKER HUGHES COMPANY
13.2.8. WESTPORT FUEL SYSTEMS INC.
13.2.9. KITZ CORPORATION
13.2.10. SWAGELOK COMPANY
13.2.11. GSR VENTILTECHNIK GMBH & CO. KG
13.2.12. HIGH PRESSURE EQUIPMENT COMPANY
13.2.13. VELAN INC.
13.2.14. ROTAREX
13.2.15. MAXIMATOR GMBH
13.2.16. KEVIN STEEL
13.2.17. JAKSA D.O.O.
13.2.18. VEXVE OY
13.2.19. CAM S.P.A.
13.2.20. OLIVER VALVES LTD.
13.2.21. ADAMS ARMATUREN GMBH
13.2.22. HARTMANN VALVES GMBH
13.2.23. OMB SALERI S.P.A.
13.2.24. GEFA PROCESSTECHNIK GMBH
13.2.25. HABONIM
13.2.26. Other Market Players
Hydrogen Valve Market By Valve Type-

Hydrogen Valve Market By Material-
Hydrogen Valve Market By Pressure Range-
Hydrogen Valve Market By Size-
Hydrogen Valve Market By Implementation Type-
Hydrogen Valve Market By Application-
Hydrogen Valve Market By End-Use Industry-
Hydrogen Valve Market By Region-
North America-
Europe-
Asia-Pacific-
Latin America-
Middle East & Africa-
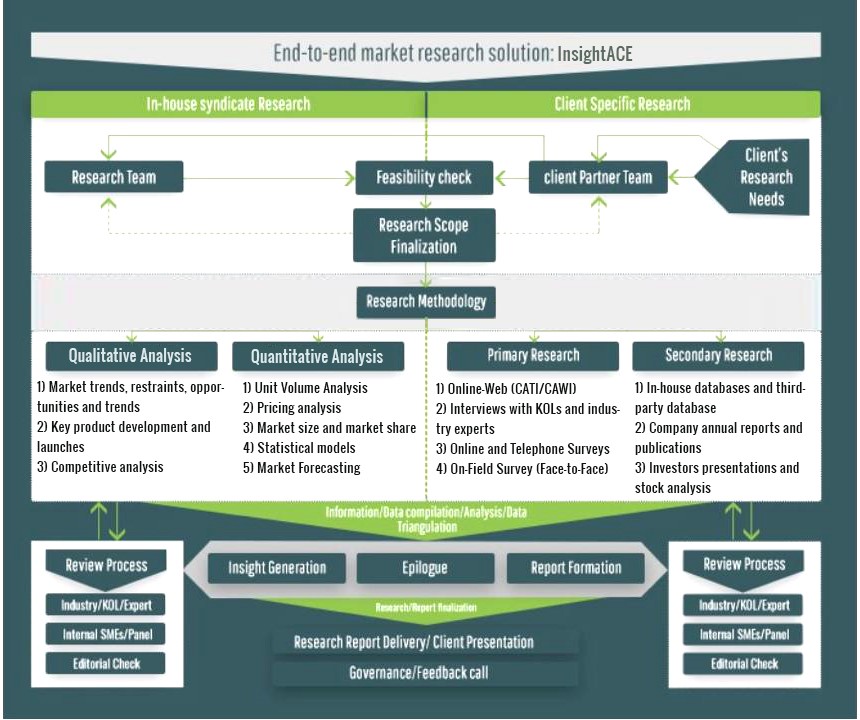
InsightAce Analytic follows a standard and comprehensive market research methodology focused on offering the most accurate and precise market insights. The methods followed for all our market research studies include three significant steps – primary research, secondary research, and data modeling and analysis - to derive the current market size and forecast it over the forecast period. In this study, these three steps were used iteratively to generate valid data points (minimum deviation), which were cross-validated through multiple approaches mentioned below in the data modeling section.
Through secondary research methods, information on the market under study, its peer, and the parent market was collected. This information was then entered into data models. The resulted data points and insights were then validated by primary participants.
Based on additional insights from these primary participants, more directional efforts were put into doing secondary research and optimize data models. This process was repeated till all data models used in the study produced similar results (with minimum deviation). This way, this iterative process was able to generate the most accurate market numbers and qualitative insights.
Secondary research
The secondary research sources that are typically mentioned to include, but are not limited to:
The paid sources for secondary research like Factiva, OneSource, Hoovers, and Statista
Primary Research:
Primary research involves telephonic interviews, e-mail interactions, as well as face-to-face interviews for each market, category, segment, and subsegment across geographies
The contributors who typically take part in such a course include, but are not limited to:
Data Modeling and Analysis:
In the iterative process (mentioned above), data models received inputs from primary as well as secondary sources. But analysts working on these models were the key. They used their extensive knowledge and experience about industry and topic to make changes and fine-tuning these models as per the product/service under study.
The standard data models used while studying this market were the top-down and bottom-up approaches and the company shares analysis model. However, other methods were also used along with these – which were specific to the industry and product/service under study.
