
Global Flavor Enhancer Market Size is valued at USD 9.5 Bn in 2024 and is predicted to reach USD 18.1 Bn by the year 2034 at a 6.8% CAGR during the forecast period for 2025-2034.
Key Industry Insights & Findings from the Report:

The usage of flavor enhancers improves the taste and texture of food items. These flavor enhancers are found in commercial snacks. Soups, frozen snacks, and other junk food products are a few examples of snacks that contain these flavor enhancers. These flavor enhancers can be found in various sweets, savory foods, and condiments. The demand for flavorful products will likely lead to a significant expansion in the flavors and flavor enhancers market. The rise in fast food consumption and changes in consumer lives has led to an increase in the demand for processed food products. As a result, there will continuously be a demand for flavors and flavor enhancers, directly affecting the product market.
However, given that flavor enhancers are produced artificially, rising consumer knowledge of health issues is a significant barrier to their use. The creation of natural flavor enhancers has opened up new market expansion potential.
The flavor enhancer market is segmented into type, application, form and source. Type segment includes acidulants, glutamates, hydrolyzed vegetable protein, yeast extracts, and others (sweetness enhancers and nucleotides). Application segment includes flavour enhancers for convenience foods, beverage flavour enhancers, meat & fish products flavour enhancers, bakery products flavour enhancers, dairy products flavour enhancers, confectionery products flavour enhancers, and flavour enhancers for other applications. Form segment includes powder, liquid & semi-liquid. Source, segment includes natural and synthetic.
The glutamate segment is anticipated to dominate the market in terms of the frequency range throughout the forecast period. The most typical application of monosodium glutamate (MSG) is as a taste enhancer in savory food. Due to the rising demand for monosodium glutamate (MSG) in savory foods and meat products, glutamates will continue to represent the most extensive product type segment over the projection period. Fish, beef, and milk are a few examples of foods high in protein that utilize monosodium glutamate extensively. The market for food flavor enhancers is expanding thanks to how intrigued consumers are by food products' various tastes and flavors worldwide. Another element driving the market for food flavor enhancers is the flavor enhancer's broad applicability.
The meat and fish category dominates the flavor enhancement market over the forecast period. Growing demand for good taste, aroma, and palatability in convenience foods has contributed to the growing demand for flavor enhancers on the global market. Changing lifestyles and food habits have grown the demand for flavor enhancers in the market. Powdered ingredients such as meat and seafood have driven up the need for flavor enhancers in the market.
The top-grossing market for flavor enhancers is North America, with significant demand. In this market, there is a higher production of these additives. In this industry, organic additives are in high demand. Additionally, U.S. and Canadian investments are a factor in the market's rapid expansion. Additionally, Asia Pacific has the maximum shares in the second-largest Flavor Enhancer Market. In this market, glutamate additive manufacturing is higher. The highest rates of additive uptake are being seen in chains and Japan. The processed food sector has a significant need for the artificial additives market.
|
Report Attribute |
Specifications |
|
Market size value in 2024 |
USD 9.5 Bn |
|
Revenue forecast in 2034 |
USD 18.1 Bn |
|
Growth rate CAGR |
CAGR of 6.8% from 2025 to 2034 |
|
Quantitative units |
Representation of revenue in US$ Bn, and CAGR from 2025 to 2034 |
|
Historic Year |
2021 to 2024 |
|
Forecast Year |
2025-2034 |
|
Report coverage |
The forecast of revenue, the position of the company, the competitive market statistics, growth prospects, and trends |
|
Segments covered |
Type, Application, Form And Source |
|
Regional scope |
North America; Europe; Asia Pacific; Latin America; Middle East & Africa |
|
Country scope |
U.S.; Canada; U.K.; Germany; China; India; Japan; Brazil; Mexico; The UK; France; Italy; Spain; China; Japan; India; South Korea; Southeast Asia; South Korea; Southeast Asia |
|
Competitive Landscape |
Cargill (U.S.), Tate & Lyle PLC (U.K.), Associated British Foods plc (U.S.), Corbion N.V. (Netherlands), and Sensient Technologies (U.S.) Novozymes A/S (Denmark), E.I. DuPont de Nemous and Company (U.S.), Angel Yeast Co., Ltd (China), Innova Flavors (U.S.), Savoury Systems International, Inc (U.S.), Senomox, Inc. (U.S.), and Ajinomoto Co.Inc. (Japan) |
|
Customization scope |
Free customization report with the procurement of the report, Modifications to the regional and segment scope. Particular Geographic competitive landscape. |
|
Pricing and available payment methods |
Explore pricing alternatives that are customized to your particular study requirements. |
Chapter 1. Methodology and Scope
1.1. Research Methodology
1.2. Research Scope & Assumptions
Chapter 2. Executive Summary
Chapter 3. Global Flavor Enhancer Market Snapshot
Chapter 4. Global Flavor Enhancer Market Variables, Trends & Scope
4.1. Market Segmentation & Scope
4.2. Drivers
4.3. Challenges
4.4. Trends
4.5. Investment and Funding Analysis
4.6. Industry Analysis – Porter’s Five Forces Analysis
4.7. Competitive Landscape & Market Share Analysis
4.8. Impact of Covid-19 Analysis
Chapter 5. Market Segmentation 1: by Type Estimates & Trend Analysis
5.1. by Type & Market Share, 2024 & 2034
5.2. Market Size (Value (US$ Mn)) & Forecasts and Trend Analyses, 2021 to 2034 for the following by Type:
5.2.1. Acidulants
5.2.2. Glutamates
5.2.3. Hydrolyzed vegetable protein
5.2.4. yeast extracts
5.2.5. Others (sweetness enhancers and nucleotides)
Chapter 6. Market Segmentation 2: by Application Estimates & Trend Analysis
6.1. by Application & Market Share, 2024 & 2034
6.2. Market Size (Value (US$ Mn)) & Forecasts and Trend Analyses, 2021 to 2034 for the following by Application:
6.2.1. Convenience Foods
6.2.2. Beverage
6.2.3. Meat & Fish Products
6.2.4. Bakery Products
6.2.5. Dairy Products
6.2.6. Confectionery Products
6.2.7. Other Applications
Chapter 7. Market Segmentation 3: by Form Estimates & Trend Analysis
7.1. by Form & Market Share, 2024 & 2034
7.2. Market Size (Value (US$ Mn)) & Forecasts and Trend Analyses, 2021 to 2034 for the following by Form:
7.2.1. Powder
7.2.2. Liquid & semi-liquid
Chapter 8. Market Segmentation 4: by Source Estimates & Trend Analysis
8.1. by Source & Market Share, 2024 & 2034
8.2. Market Size (Value (US$ Mn)) & Forecasts and Trend Analyses, 2021 to 2034 for the following by Source:
8.2.1. Natural
8.2.2. Synthetic
Chapter 9. Flavor Enhancer Market Segmentation 5: Regional Estimates & Trend Analysis
9.1. North America
9.1.1. North America Flavor Enhancer Market Revenue (US$ Million) Estimates and Forecasts by Type, 2021-2034
9.1.2. North America Flavor Enhancer Market Revenue (US$ Million) Estimates and Forecasts by Application, 2021-2034
9.1.3. North America Flavor Enhancer Market Revenue (US$ Million) Estimates and Forecasts by Form, 2021-2034
9.1.4. North America Flavor Enhancer Market Revenue (US$ Million) Estimates and Forecasts by Source, 2021-2034
9.1.5. North America Flavor Enhancer Market Revenue (US$ Million) Estimates and Forecasts by country, 2021-2034
9.2. Europe
9.2.1. Europe Flavor Enhancer Market Revenue (US$ Million) Estimates and Forecasts by Type, 2021-2034
9.2.2. Europe Flavor Enhancer Market Revenue (US$ Million) Estimates and Forecasts by Application, 2021-2034
9.2.3. Europe Flavor Enhancer Market Revenue (US$ Million) Estimates and Forecasts by Form, 2021-2034
9.2.4. Europe Flavor Enhancer Market Revenue (US$ Million) Estimates and Forecasts by Source, 2021-2034
9.2.5. Europe Flavor Enhancer Market Revenue (US$ Million) Estimates and Forecasts by country, 2021-2034
9.3. Asia Pacific
9.3.1. Asia Pacific Flavor Enhancer Market Revenue (US$ Million) Estimates and Forecasts by Type, 2021-2034
9.3.2. Asia Pacific Flavor Enhancer Market Revenue (US$ Million) Estimates and Forecasts by Application, 2021-2034
9.3.3. Asia-Pacific Flavor Enhancer Market Revenue (US$ Million) Estimates and Forecasts by Form, 2021-2034
9.3.4. Asia-Pacific Flavor Enhancer Market Revenue (US$ Million) Estimates and Forecasts by Source, 2021-2034
9.3.5. Asia Pacific Flavor Enhancer Market Revenue (US$ Million) Estimates and Forecasts by country, 2021-2034
9.4. Latin America
9.4.1. Latin America Flavor Enhancer Market Revenue (US$ Million) Estimates and Forecasts by Type, 2021-2034
9.4.2. Latin America Flavor Enhancer Market Revenue (US$ Million) Estimates and Forecasts by Application, 2021-2034
9.4.3. Latin America Flavor Enhancer Market Revenue (US$ Million) Estimates and Forecasts by Form, 2021-2034
9.4.4. Latin America Flavor Enhancer Market Revenue (US$ Million) Estimates and Forecasts by Source, 2021-2034
9.4.5. Latin America Flavor Enhancer Market Revenue (US$ Million) Estimates and Forecasts by country, 2021-2034
9.5. Middle East & Africa
9.5.1. Middle East & Africa Flavor Enhancer Market Revenue (US$ Million) Estimates and Forecasts by Type, 2021-2034
9.5.2. Middle East & Africa Flavor Enhancer Market Revenue (US$ Million) Estimates and Forecasts by Application, 2021-2034
9.5.3. Middle East & Africa Flavor Enhancer Market Revenue (US$ Million) Estimates and Forecasts by Form, 2021-2034
9.5.4. Middle East & Africa Flavor Enhancer Market Revenue (US$ Million) Estimates and Forecasts by Source, 2021-2034
9.5.5. Middle East & Africa Flavor Enhancer Market Revenue (US$ Million) Estimates and Forecasts by country, 2021-2034
Chapter 10. Competitive Landscape
10.1. Major Mergers and Acquisitions/Strategic Alliances
10.2. Company Profiles
10.2.1. A & Z Food Additives Co. Ltd.
10.2.2. Aipu Food Industry
10.2.3. Ajinomoto Co.Inc.
10.2.4. Angel Yeast Co., Ltd
10.2.5. Associated British Foods plc
10.2.6. Bell Flavors & Fragrances
10.2.7. Caldic B.V.
10.2.8. Cargill
10.2.9. Corbion N.V.
10.2.10. E.I. DuPont de Nemours and Company
10.2.11. Firmenich S.A.I.C. y F. (Firmenich SA)
10.2.12. FIRMENICH SA
10.2.13. Givaudan
10.2.14. Innova and DuPont Nutrition & Health
10.2.15. Kerry Group
10.2.16. Lycored
10.2.17. Mane
10.2.18. MOGUNTIA FOOD GROUP AG
10.2.19. Nikken Foods Co., Ltd.
10.2.20. Novozymes A/S
10.2.21. Savoury Systems International, Inc
10.2.22. Senomox, Inc.
10.2.23. Sensient Technologies Corporation
10.2.24. Symrise
10.2.25. Synergy Flavors, Inc.
10.2.26. Takasago International Corporation
10.2.27. Tate & Lyle PLC
10.2.28. Other Prominent Players
Flavor Enhancer Market By Product Type-

Flavor Enhancer Market By Application-
Flavor Enhancer Market By Form-
Flavor Enhancer Market By Source-
Flavor Enhancer Market By Region-
North America-
Europe-
Asia-Pacific-
Latin America-
Middle East & Africa-
InsightAce Analytic follows a standard and comprehensive market research methodology focused on offering the most accurate and precise market insights. The methods followed for all our market research studies include three significant steps – primary research, secondary research, and data modeling and analysis - to derive the current market size and forecast it over the forecast period. In this study, these three steps were used iteratively to generate valid data points (minimum deviation), which were cross-validated through multiple approaches mentioned below in the data modeling section.
Through secondary research methods, information on the market under study, its peer, and the parent market was collected. This information was then entered into data models. The resulted data points and insights were then validated by primary participants.
Based on additional insights from these primary participants, more directional efforts were put into doing secondary research and optimize data models. This process was repeated till all data models used in the study produced similar results (with minimum deviation). This way, this iterative process was able to generate the most accurate market numbers and qualitative insights.
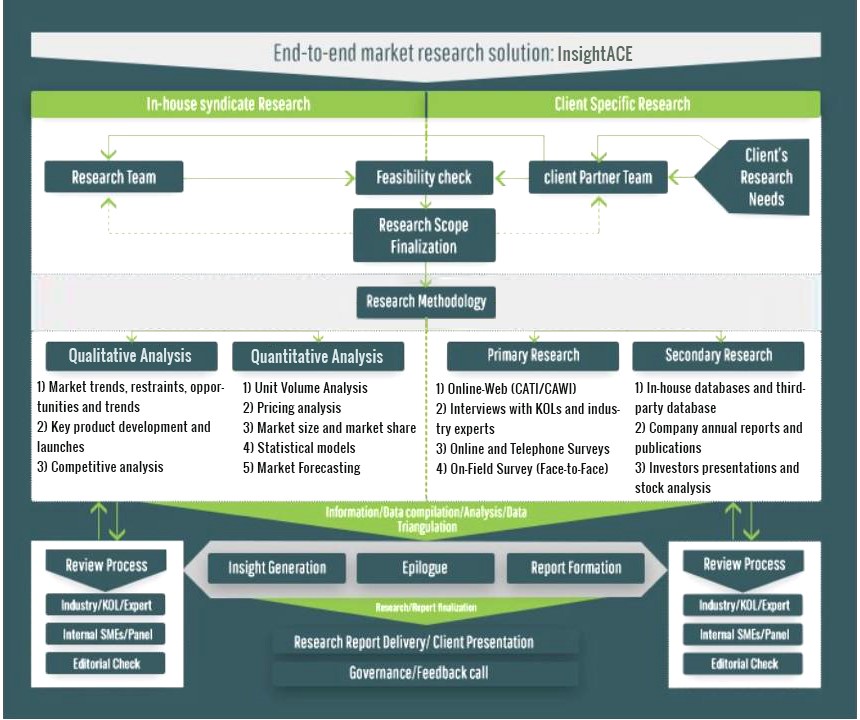
Secondary research
The secondary research sources that are typically mentioned to include, but are not limited to:
The paid sources for secondary research like Factiva, OneSource, Hoovers, and Statista
Primary Research:
Primary research involves telephonic interviews, e-mail interactions, as well as face-to-face interviews for each market, category, segment, and subsegment across geographies
The contributors who typically take part in such a course include, but are not limited to:
Data Modeling and Analysis:
In the iterative process (mentioned above), data models received inputs from primary as well as secondary sources. But analysts working on these models were the key. They used their extensive knowledge and experience about industry and topic to make changes and fine-tuning these models as per the product/service under study.
The standard data models used while studying this market were the top-down and bottom-up approaches and the company shares analysis model. However, other methods were also used along with these – which were specific to the industry and product/service under study.
To know more about the research methodology used for this study, kindly contact us/click here.
