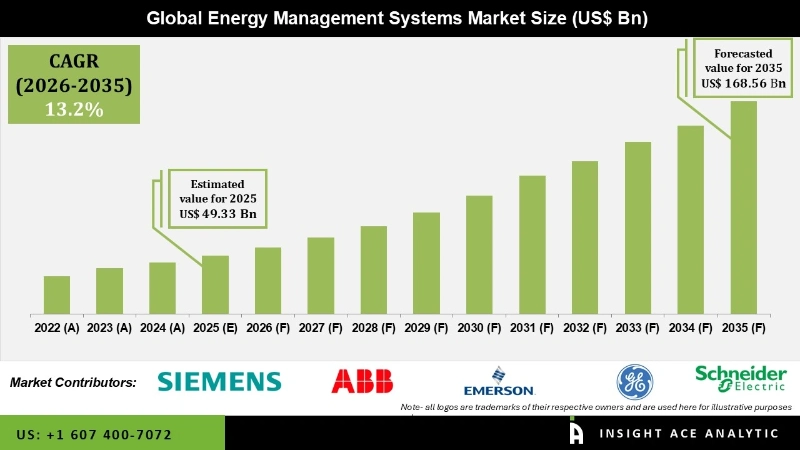
Global Energy Management Systems Market Size is valued at USD 49.33 Billion in 2025 and is predicted to reach USD 168.56 Billion by the year 2035 at a 13.2% CAGR during the forecast period for 2026 to 2035.
Energy Management Systems Market Size, Share & Trends Analysis Report By Component (Hardware, Software, Services), By Type (Home Energy Management Systems (HEMS), Building Energy Management Systems (BEMS), Industrial Energy Management Systems (IEMS)), By Deployment, By End-Use Industry, By Region, And By Segment Foreacasts, 2026 to 2035

Energy Management Systems are valuable tools for organizations looking to minimize energy costs, improve energy efficiency, and lessen their environmental impact. These systems offer a data-driven approach to energy management, allowing organizations to make informed decisions and take proactive measures to optimize energy usage. It is applicable to small-scale systems like microgrids. It is one of the new technologies that enable an organization to monitor, evaluate, and visualize energy usage to gather real-time data on energy use.
The growing utilization of smart meters and smart grids is essential for raising market value. In addition, governments worldwide are launching projects to digitize their domestic energy systems to increase their effectiveness and value and support economic growth. Various governments have focused on developing secure, economical, and sustainable energy systems, thus driving market growth.
However, the COVID-19 pandemic outbreak caused a dramatic decrease in the market. This results from the decline in energy use in heavy sectors such as those reliant on coal, oil, and natural gas. Nevertheless, the sector has persisted due to increased demand from residential energy usage. Online purchasing, remote work, running home appliances, cooling or heating homes, and streaming entertainment services have all increased since the lockdown was implemented.
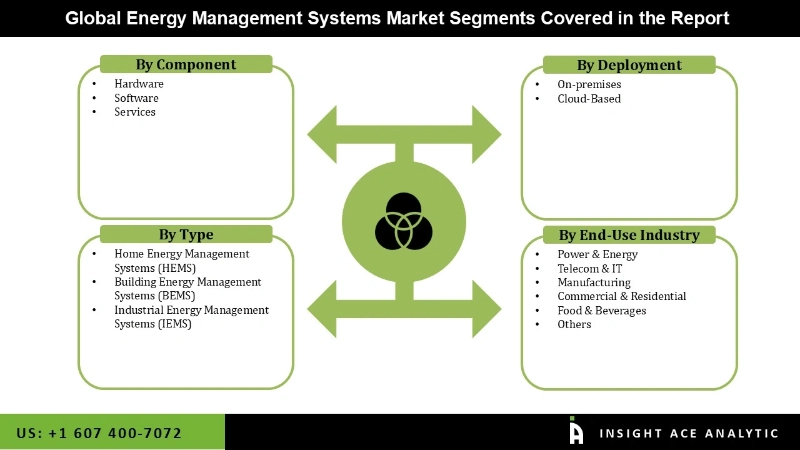
The Energy Management Systems Market is divided on the basis of component, type, deployment, and end-use industry. On the basis of components, the market is segmented into software, hardware, and services. The type segment includes Home Energy Management Systems (HEMS), Building Energy Management Systems (BEMS), Industrial Energy Management Systems (IEMS). The deployment is segmented into on-premises and cloud-based. The end-use industry segment includes power & energy, telecom & IT, manufacturing, commercial & residential, food & beverages, and others.
The food & beverage category is expected to hold a major share in the global Energy Management Systems Market. Transformers and generators used in the production of food and drinks are protected by energy management systems. Effective energy management has evolved into a business requirement for food and beverage facilities. Manufacturers are forced to change their practice of treating energy usage as an unmanaged business expense due to increased competitive pressures, narrower margins, and rising energy costs.
Even while electricity accounts for the majority of food and beverage plants' highest energy costs, it also presents the biggest chances for cost savings. It has the potential to provide the highest rates of profit. Technological advancements, new international frameworks, and a supply chain transformation to increase resilience and efficiency across the global food system are all driving unprecedented change in the food and beverage business.
The segment is expected to grow at a rapid rate in the global Energy Management Systems Market owing to the growing prevalence of sensing and communication technology. Furthermore, bridges and sensors have gained popularity, with wired sensor networks gaining popularity for being more reliable, having longer service lifetimes, and being less susceptible to interference and disturbances. With monitoring and regulating building operations gaining traction as a means of integrating intelligence, hardware components could increase the energy management systems market forecast for the duration of the projected period.
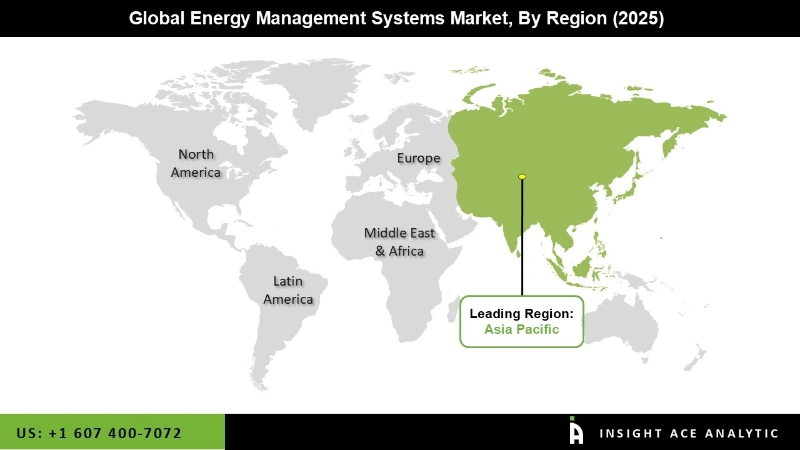
Asia Pacific region in Energy Management Systems Market is expected to record the maximum market share in terms of revenue in the near future due to the rise in digitalization and the increase in data generated by IoT devices. Furthermore, given the region's expanding energy needs and large carbon footprint, many organizations are turning to energy management systems to optimize energy resources for their operations.
Furthermore, North America is predicted to grow rapidly. Global investments in more energy-efficient infrastructure have been steadily increasing, with governments investing in a variety of initiatives such as renewable energy, adopting solutions to improve power grid efficiency, and imposing sanctions on the use of inefficient technologies.

| Report Attribute | Specifications |
| Market size value in 2025 | USD 49.33 Billion |
| Revenue forecast in 2035 | USD 168.56 Billion |
| Growth rate CAGR | CAGR of 13.2% from 2026 to 2035 |
| Quantitative units | Representation of revenue in US$ Mn and CAGR from 2026 to 2035 |
| Historic Year | 2022 to 2024 |
| Forecast Year | 2026 to 2035 |
| Report coverage | The forecast of revenue, the position of the company, the competitive market structure, growth prospects, and trends |
| Segments covered | By Component, Type, Deployment, End-User Industry |
| Regional scope | North America; Europe; Asia Pacific; Latin America; Middle East & Africa |
| Country scope | U.S.; Canada; U.K.; Germany; China; India; Japan; Brazil; Mexico; The UK; France; Italy; Spain; China; Japan; India; South Korea; South East Asia; South Korea; South East Asia |
| Competitive Landscape | ABB, Siemens, Schneider Electric, General Electric, Emerson Electric Co., Cisco Systems, Inc., Honeywell International Inc., Eaton, Mitsubishi Electric Corporation, IBM, Hitachi, Rockwell Automation, Inc., Yokogawa Electric Corporation, C3 AI, Delta Electronics, Inc, Enel X, Neptune India, Weidmuller, Energy Management Systems, Inc., Distech Controls |
| Customization scope | Free customization report with the procurement of the report, Modifications to the regional and segment scope. Particular Geographic competitive landscape. |
| Pricing and available payment methods | Explore pricing alternatives that are customized to your particular study requirements. |

North America-
Europe-
Asia-Pacific-
Latin America-
Middle East & Africa-
This study employed a multi-step, mixed-method research approach that integrates:
This approach ensures a balanced and validated understanding of both macro- and micro-level market factors influencing the market.
Secondary research for this study involved the collection, review, and analysis of publicly available and paid data sources to build the initial fact base, understand historical market behaviour, identify data gaps, and refine the hypotheses for primary research.
Secondary data for the market study was gathered from multiple credible sources, including:
These sources were used to compile historical data, market volumes/prices, industry trends, technological developments, and competitive insights.

Primary research was conducted to validate secondary data, understand real-time market dynamics, capture price points and adoption trends, and verify the assumptions used in the market modelling.
Primary interviews for this study involved:
Interviews were conducted via:
Primary insights were incorporated into demand modelling, pricing analysis, technology evaluation, and market share estimation.
All collected data were processed and normalized to ensure consistency and comparability across regions and time frames.
The data validation process included:
This ensured that the dataset used for modelling was clean, robust, and reliable.
The bottom-up approach involved aggregating segment-level data, such as:
This method was primarily used when detailed micro-level market data were available.

The top-down approach used macro-level indicators:
This approach was used for segments where granular data were limited or inconsistent.
To ensure accuracy, a triangulated hybrid model was used. This included:
This multi-angle validation yielded the final market size.
Market forecasts were developed using a combination of time-series modelling, adoption curve analysis, and driver-based forecasting tools.
Given inherent uncertainties, three scenarios were constructed:
Sensitivity testing was conducted on key variables, including pricing, demand elasticity, and regional adoption.