
Global Electric Vehicle Charging Infrastructure Market Size is valued at USD 7.3 Bn in 2024 and is predicted to reach USD 16.5 Bn by the year 2034 at a 8.6% CAGR during the forecast period for 2025-2034.
Key Industry Insights & Findings from the Report:

The Internal Combustion Engine (ICE), which needs fuel and gases to produce power, is not used in Electric Vehicles (EVs), which run on electric motors. The facility utilised to supply the electric energy source to recharge electric vehicles is known as the electric vehicle charging infrastructure. Some vehicles can be set up overnight at a residence or place of employment.
However, it is always impractical and ineffective for the long run. The need for electric cars has arisen as a result of the increase in carbon emissions and other hazardous compounds produced by transportation. As a result, both commercial and residential environments require an infrastructure for electric vehicle (EV) charging.
Additionally, it is projected that growing industry alliances among automakers to provide subscription-based charging stations would promote business growth. Over the course of the projected period, rising demand for green energy is anticipated to further fuel EV charging infrastructure market development. Green energy is anticipated to significantly support the fast growing trend in both public and private electric charging stations. Government efforts to upgrade EV charging infrastructure are likely to increase, which will significantly boost EV charging infrastructure industry expansion.
The sales of electric vehicles have expanded exponentially in recent years, along with their improved performance, wider model availability, and longer range. The IEA's Global EV Outlook 2024 states that sales of electric vehicles approached 14 million in 2023, with the United States, China, and Europe accounting for 95% of these sales.
Additionally, during the projected period, the demand for commercial infrastructure and household charging stations for plug-in electric vehicles is expected to increase. But during the course of the forecast period, a number of issues, including the high setup costs of fast chargers and the lack of standardised plug types, are anticipated to restrain the EV charging infrastructure market revenue growth.
The electric vehicle charging infrastructure market is segregated based on charging point type, level of charging, installation type, vehicle type, charging service, dc fast charging type, charging infrastructure type, and end-user. Charging point type segment includes AC and DC charging, Level of charging segment includes Level 1, Level 2, and Level 3, Installation type segment includes fixed and portable. Vehicle type segment includes Passengers Cares, Battery electric vehicle, plug-in hybrid vehicle, heavy commercial vehicles, light commercial vehicles, and two wheelers & scooters. The charging service segment includes EV charging and battery swapping services. DC fast charging type segment includes Slow DC (349 kW). Charging infrastructure type segment includes Normal Charging, Type 2, CCS, CHAdeMO, Tesla SC (NACS), and GB/T Fast. End-user segment includes residential and commercial EV charging stations.
The category of DC charging gained the largest revenue share, and it is expected that this trend will persist over the projected period. EV Fast charging, also referred to as Level 3 charging or DC charging, provides vehicles with significantly quicker charging durations in comparison to AC charging. The development of rapid DC adapters for rapid charging of electric vehicles is the primary factor propelling the expansion of the worldwide market. Rapid DC charging has enabled vehicle owners and drivers to recharge their devices while traveling or taking a brief break, as opposed to having to leave them connected overnight for several hours to fully charge. Range anxiety has been reduced by the expansion of public—and specifically rapid charging—infrastructure. An increasing preference among consumers to reduce the time required to recharge electric vehicle (EV) batteries has led to a surge in the need for DC rapid charging stations.
The commercial category is anticipated to grow at a significant rate over the forecast period. Public electric vehicle charging infrastructure is in greater demand as a result of the historic move to electric automobiles. The development of a charging infrastructure has not yet kept pace with the surge in sales of electric vehicles. The demand for public charging infrastructures would only grow as the price of electric vehicles fluctuated and dropped, entering new markets, notably for inhabitants of multi-unit buildings. The ideal candidates for hosting electric vehicle charging infrastructures would also be stores.
The Asia Pacific electric vehicle charging infrastructure market is expected to report the highest market share in revenue in the near future. The Asia Pacific market is projected to be fueled by China's rapid expansion of EV charging infrastructure, rising consumer demand for reasonably priced EVs for daily usage, and government-led EV promotion. The IEA projects that China is leading the way in the worldwide electric vehicle market in its annual Global EV Outlook. 2023 year witnessed 8.1 million new electric car registrations in China, a 35% rise from year 2022. Robust sales of electric vehicles is the primary factor driving regional growth in the EV charging infrastructure market.
The nation's rapid economic growth will support the spread of cutting-edge technologies to enhance electrification in China during the predicted period. In addition, Europe is projected to grow at a rapid rate in the global electric vehicle charging infrastructure market due to the location of important market participants. Market expansion in this region is probably going to be fueled by consumer adoption of EVs, driverless vehicles, and shared mobility. The market in this region is anticipated to be driven by factors including the tightening government regulations on car emissions, the quick adoption of new technologies, and the significant investment in product innovation.
|
Report Attribute |
Specifications |
|
Market size value in 2024 |
USD 7.3 Bn |
|
Revenue forecast in 2034 |
USD 16.5 Bn |
|
Growth rate CAGR |
CAGR of 8.6% from 2025 to 2034 |
|
Quantitative units |
Representation of revenue in US$ Bn, Volume (Units), and CAGR from 2025 to 2034 |
|
Historic Year |
2021 to 2024 |
|
Forecast Year |
2025-2034 |
|
Report coverage |
The forecast of revenue, the position of the company, the competitive market statistics, growth prospects, and trends |
|
Segments covered |
By charging point type, level of charging, installation type, vehicle type, charging service, dc fast charging type, charging infrastructure type, and end-user |
|
Regional scope |
North America; Europe; Asia Pacific; Latin America; Middle East & Africa |
|
Country scope |
U.S.; Canada; U.K.; Germany; China; India; Japan; Brazil; Mexico; The UK; France; Italy; Spain; China; Japan; India; South Korea; Southeast Asia; South Korea; Southeast Asia |
|
Competitive Landscape |
ABB Ltd., AeroViroment, Inc., Alfen N.V., Allego, Blink Charging Co., Chargemaster plc., ChargePoint, Inc., ClipperCreek, Denso Corporation, Efacec, Elix Wireless, Engie, Evatran Group, EVgo Services LLC., General Electric, HellaKGaAHueck& Co., Infineon Technologies AG, Leviton Manufacturing Co., Inc., Mojo Mobility, Inc., Qualcomm Technologies, Inc., Robert Bosch GmbH, Scheinder Electric, Siemens AG, Tesla Inc., Toshiba Corporation, Wi Tricity Corporation |
|
Customization scope |
Free customization report with the procurement of the report, Modifications to the regional and segment scope. Particular Geographic competitive landscape. |
|
Pricing and available payment methods |
Explore pricing alternatives that are customized to your particular study requirements. |
Chapter 1. Methodology and Scope
1.1. Research Methodology
1.2. Research Scope & Assumptions
Chapter 2. Executive Summary
Chapter 3. Global Electric Vehicle Charging Infrastructure Market Snapshot
Chapter 4. Global Electric Vehicle Charging Infrastructure Market Variables, Trends & Scope
4.1. Market Segmentation & Scope
4.2. Drivers
4.3. Challenges
4.4. Trends
4.5. Investment and Funding Analysis
4.6. Industry Analysis – Porter’s Five Forces Analysis
4.7. Competitive Landscape & Market Share Analysis
4.8. Impact of Covid-19 Analysis
Chapter 5. Market Segmentation 1: by Charging Point Type Estimates & Trend Analysis
5.1. by Charging Point Type & Market Share, 2024 & 2034
5.2. Market Size (Value (US$ Mn) & Volume (Units)) & Forecasts and Trend Analyses, 2019 to 2034 for the following by Charging Point Type:
5.2.1. AC Charging
5.2.2. DC Charging
Chapter 6. Market Segmentation 2: by Level of Charging Estimates & Trend Analysis
6.1. by Level of Charging & Market Share, 2024 & 2034
6.2. Market Size (Value (US$ Mn) & Volume (Units)) & Forecasts and Trend Analyses, 2019 to 2034 for the following by Level of Charging:
6.2.1. Level 1
6.2.2. Level 2
6.2.3. Level 3
Chapter 7. Market Segmentation 3: by Installation Type Estimates & Trend Analysis
7.1. by Installation Type & Market Share, 2024 & 2034
7.2. Market Size (Value (US$ Mn) & Volume (Units)) & Forecasts and Trend Analyses, 2019 to 2034 for the following by Installation Type:
7.2.1. Fixed
7.2.2. Portable
Chapter 8. Market Segmentation 4: by Vehicle Type Estimates & Trend Analysis
8.1. by Vehicle Type & Market Share, 2024 & 2034
8.2. Market Size (Value (US$ Mn) & Volume (Units)) & Forecasts and Trend Analyses, 2019 to 2034 for the following by Vehicle Type:
8.2.1. Passenger Cars
8.2.2. Battery Electric Vehicle (BEV)
8.2.3. Plug-in Hybrid Vehicle(PHEV)
8.2.4. Heavy Commercial Vehicles
8.2.5. Light Commercial Vehicles
8.2.6. Two-wheelers & Scooters
Chapter 9. Market Segmentation 5: by Charging Service Estimates & Trend Analysis
9.1. by Charging Service & Market Share, 2019 & 2034
9.2. Market Size (Value (US$ Mn) & Volume (Units)) & Forecasts and Trend Analyses, 2019 to 2034 for the following by Charging Service:
9.2.1. EV Charging Service
9.2.2. Battery Swapping Service
Chapter 10. Market Segmentation 6: by DC Fast Charging Type Estimates & Trend Analysis
10.1. by DC Fast Charging Type & Market Share, 2019 & 2034
10.2. Market Size (Value (US$ Mn) & Volume (Units)) & Forecasts and Trend Analyses, 2019 to 2034 for the following by DC Fast Charging Type:
10.2.1. Slow DC (
10.2.2. Fast DC (50-149 kW)
10.2.3. DC Ultra-Fast 1 (150-349 KW)
10.2.4. DC Ultra-Fast 2 (>349 kW)
Chapter 11. Market Segmentation 7: by Charging Infrastructure Type Estimates & Trend Analysis
11.1. by Charging Infrastructure Type & Market Share, 2019 & 2034
11.2. Market Size (Value (US$ Mn) & Volume (Units)) & Forecasts and Trend Analyses, 2019 to 2034 for the following by Charging Infrastructure Type:
11.2.1. Normal Charging
11.2.2. Type 2
11.2.3. CCS
11.2.4. CHAdeMO
11.2.5. Tesla SC (NACS)
11.2.6. GB/T Fast
Chapter 12. Market Segmentation 8: by End-User Estimates & Trend Analysis
12.1. by End-User & Market Share, 2019 & 2034
12.2. Market Size (Value (US$ Mn) & Volume (Units)) & Forecasts and Trend Analyses, 2019 to 2034 for the following by End-User:
12.2.1. Commercial EV Charging Stations
12.2.1. Residential EV Charging Stations
Chapter 13. Electric Vehicle Charging Infrastructure Market Segmentation 4: Regional Estimates & Trend Analysis
13.1. North America
13.1.1. North America Electric Vehicle Charging Infrastructure Market Revenue (US$ Million) & Volume (Units) Estimates and Forecasts by Charging Point Type, 2021-2034
13.1.2. North America Electric Vehicle Charging Infrastructure Market Revenue (US$ Million) & Volume (Units) Estimates and Forecasts by Level of Charging, 2021-2034
13.1.3. North America Electric Vehicle Charging Infrastructure Market Revenue (US$ Million) & Volume (Units) Estimates and Forecasts by Installation Type, 2021-2034
13.1.4. North America Electric Vehicle Charging Infrastructure Market Revenue (US$ Million) & Volume (Units) Estimates and Forecasts By Vehicle Type, 2021-2034
13.1.5. North America Electric Vehicle Charging Infrastructure Market Revenue (US$ Million) & Volume (Units) Estimates and Forecasts By Charging Service, 2021-2034
13.1.6. North America Electric Vehicle Charging Infrastructure Market Revenue (US$ Million) & Volume (Units) Estimates and Forecasts By DC Fast Charging Type, 2021-2034
13.1.7. North America Electric Vehicle Charging Infrastructure Market Revenue (US$ Million) & Volume (Units) Estimates and Forecasts By Charging Infrastructure Type, 2021-2034
13.1.8. North America Electric Vehicle Charging Infrastructure Market Revenue (US$ Million) & Volume (Units) Estimates and Forecasts By End User, 2021-2034
13.1.9. North America Electric Vehicle Charging Infrastructure Market Revenue (US$ Million) & Volume (Units) Estimates and Forecasts by country, 2021-2034
13.2. Europe
13.2.1. Europe Electric Vehicle Charging Infrastructure Market Revenue (US$ Million) & Volume (Units) Estimates and Forecasts by Charging Point Type, 2021-2034
13.2.2. Europe Electric Vehicle Charging Infrastructure Market Revenue (US$ Million) & Volume (Units) Estimates and Forecasts by Level of Charging, 2021-2034
13.2.3. Europe Electric Vehicle Charging Infrastructure Market Revenue (US$ Million) & Volume (Units) Estimates and Forecasts by Installation Type, 2021-2034
13.2.4. Europe Electric Vehicle Charging Infrastructure Market Revenue (US$ Million) & Volume (Units) Estimates and Forecasts By Vehicle Type, 2021-2034
13.2.5. Europe Electric Vehicle Charging Infrastructure Market Revenue (US$ Million) & Volume (Units) Estimates and Forecasts By Charging Service, 2021-2034
13.2.6. Europe Electric Vehicle Charging Infrastructure Market Revenue (US$ Million) & Volume (Units) Estimates and Forecasts By DC Fast Charging Type, 2021-2034
13.2.7. Europe Electric Vehicle Charging Infrastructure Market Revenue (US$ Million) & Volume (Units) Estimates and Forecasts By Charging Infrastructure Type, 2021-2034
13.2.8. Europe Electric Vehicle Charging Infrastructure Market Revenue (US$ Million) & Volume (Units) Estimates and Forecasts By End User, 2021-2034
13.2.9. Europe Electric Vehicle Charging Infrastructure Market Revenue (US$ Million) & Volume (Units) Estimates and Forecasts by country, 2021-2034
13.3. Asia Pacific
13.3.1. Asia Pacific Electric Vehicle Charging Infrastructure Market Revenue (US$ Million) & Volume (Units) Estimates and Forecasts by Charging Point Type, 2021-2034
13.3.2. Asia Pacific Electric Vehicle Charging Infrastructure Market Revenue (US$ Million) & Volume (Units) Estimates and Forecasts by Level of Charging, 2021-2034
13.3.3. Asia-Pacific Electric Vehicle Charging Infrastructure Market Revenue (US$ Million) & Volume (Units) Estimates and Forecasts by Installation Type, 2021-2034
13.3.4. Asia Pacific Electric Vehicle Charging Infrastructure Market Revenue (US$ Million) & Volume (Units) Estimates and Forecasts By Vehicle Type, 2021-2034
13.3.5. Asia Pacific Electric Vehicle Charging Infrastructure Market Revenue (US$ Million) & Volume (Units) Estimates and Forecasts By Charging Service, 2021-2034
13.3.6. Asia Pacific Electric Vehicle Charging Infrastructure Market Revenue (US$ Million) & Volume (Units) Estimates and Forecasts By DC Fast Charging Type, 2021-2034
13.3.7. Asia Pacific Electric Vehicle Charging Infrastructure Market Revenue (US$ Million) & Volume (Units) Estimates and Forecasts By Charging Infrastructure Type, 2021-2034
13.3.8. Asia Pacific Electric Vehicle Charging Infrastructure Market Revenue (US$ Million) & Volume (Units) Estimates and Forecasts By End User, 2021-2034
13.3.9. Asia Pacific Electric Vehicle Charging Infrastructure Market Revenue (US$ Million) & Volume (Units) Estimates and Forecasts by country, 2021-2034
13.4. Latin America
13.4.1. Latin America Electric Vehicle Charging Infrastructure Market Revenue (US$ Million) & Volume (Units) Estimates and Forecasts by Charging Point Type, 2021-2034
13.4.2. Latin America Electric Vehicle Charging Infrastructure Market Revenue (US$ Million) & Volume (Units) Estimates and Forecasts by Level of Charging, 2021-2034
13.4.3. Latin America Electric Vehicle Charging Infrastructure Market Revenue (US$ Million) & Volume (Units) Estimates and Forecasts by Installation Type, 2021-2034
13.4.4. Latin America Electric Vehicle Charging Infrastructure Market Revenue (US$ Million) & Volume (Units) Estimates and Forecasts By Vehicle Type, 2021-2034
13.4.5. Latin America Electric Vehicle Charging Infrastructure Market Revenue (US$ Million) & Volume (Units) Estimates and Forecasts By Charging Service, 2021-2034
13.4.6. Latin America Electric Vehicle Charging Infrastructure Market Revenue (US$ Million) & Volume (Units) Estimates and Forecasts By DC Fast Charging Type, 2021-2034
13.4.7. Latin America Electric Vehicle Charging Infrastructure Market Revenue (US$ Million) & Volume (Units) Estimates and Forecasts By Charging Infrastructure Type, 2021-2034
13.4.8. Latin America Electric Vehicle Charging Infrastructure Market Revenue (US$ Million) & Volume (Units) Estimates and Forecasts By End User, 2021-2034
13.4.9. Latin America Electric Vehicle Charging Infrastructure Market Revenue (US$ Million) & Volume (Units) Estimates and Forecasts by country, 2021-2034
13.5. Middle East & Africa
13.5.1. Middle East & Africa Electric Vehicle Charging Infrastructure Market Revenue (US$ Million) & Volume (Units) Estimates and Forecasts by Charging Point Type, 2021-2034
13.5.2. Middle East & Africa Electric Vehicle Charging Infrastructure Market Revenue (US$ Million) & Volume (Units) Estimates and Forecasts by Level of Charging, 2021-2034
13.5.3. Middle East & Africa Electric Vehicle Charging Infrastructure Market Revenue (US$ Million) & Volume (Units) Estimates and Forecasts by Installation Type, 2021-2034
13.5.4. Middle East & Africa Electric Vehicle Charging Infrastructure Market Revenue (US$ Million) & Volume (Units) Estimates and Forecasts By Vehicle Type, 2021-2034
13.5.5. Middle East & Africa Electric Vehicle Charging Infrastructure Market Revenue (US$ Million) & Volume (Units) Estimates and Forecasts By Charging Service, 2021-2034
13.5.6. Middle East & Africa Electric Vehicle Charging Infrastructure Market Revenue (US$ Million) & Volume (Units) Estimates and Forecasts By DC Fast Charging Type, 2021-2034
13.5.7. Middle East & Africa Electric Vehicle Charging Infrastructure Market Revenue (US$ Million) & Volume (Units) Estimates and Forecasts By Charging Infrastructure Type, 2021-2034
13.5.8. Middle East & Africa Electric Vehicle Charging Infrastructure Market Revenue (US$ Million) & Volume (Units) Estimates and Forecasts By End User, 2021-2034
13.5.9. Middle East & Africa Electric Vehicle Charging Infrastructure Market Revenue (US$ Million) & Volume (Units) Estimates and Forecasts by country, 2021-2034
Chapter 14. Competitive Landscape
14.1. Major Mergers and Acquisitions/Strategic Alliances
14.2. Company Profiles
14.2.1. ABB Ltd.
14.2.2. AeroViroment, Inc.
14.2.3. Alfen N.V.
14.2.4. Allego
14.2.5. Blink Charging Co.
14.2.6. Chargemaster plc.
14.2.7. ChargePoint, Inc.
14.2.8. ClipperCreek
14.2.9. Denso Corporation
14.2.10. Efacec
14.2.11. Elix Wireless
14.2.12. Engie
14.2.13. Evatran Group
14.2.14. EVgo Services LLC.
14.2.15. General Electric
14.2.16. HellaKGaAHueck& Co.
14.2.17. Infineon Technologies AG
14.2.18. Leviton Manufacturing Co., Inc.
14.2.19. Mojo Mobility, Inc.
14.2.20. Qualcomm Technologies, Inc.
14.2.21. Robert Bosch GmbH
14.2.22. Scheinder Electric
14.2.23. Siemens AG
14.2.24. Tesla Inc.
14.2.25. Toshiba Corporation
14.2.26. Wi Tricity Corporation
14.2.27. Other Prominent Players
Electric Vehicle Charging Infrastructure Market By Charging Point Type:

Electric Vehicle Charging Infrastructure Market By Level of Charging:
Electric Vehicle Charging Infrastructure Market By Installation Type:
Electric Vehicle Charging Infrastructure Market By Vehicle Type
Electric Vehicle Charging Infrastructure Market By Charging Service:
Electric Vehicle Charging Infrastructure Market By DC Fast Charging Type:
Electric Vehicle Charging Infrastructure Market By Charging Infrastructure Type:
Electric Vehicle Charging Infrastructure Market By End User
Electric Vehicle Charging Infrastructure Market By Region-
North America-
Europe-
Asia-Pacific-
Latin America-
Middle East & Africa-
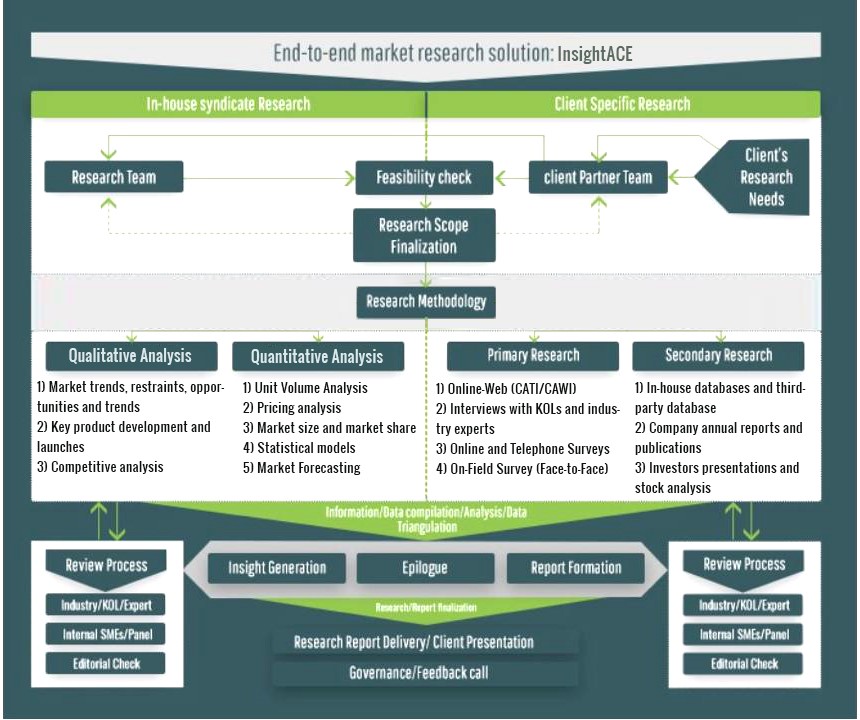
InsightAce Analytic follows a standard and comprehensive market research methodology focused on offering the most accurate and precise market insights. The methods followed for all our market research studies include three significant steps – primary research, secondary research, and data modeling and analysis - to derive the current market size and forecast it over the forecast period. In this study, these three steps were used iteratively to generate valid data points (minimum deviation), which were cross-validated through multiple approaches mentioned below in the data modeling section.
Through secondary research methods, information on the market under study, its peer, and the parent market was collected. This information was then entered into data models. The resulted data points and insights were then validated by primary participants.
Based on additional insights from these primary participants, more directional efforts were put into doing secondary research and optimize data models. This process was repeated till all data models used in the study produced similar results (with minimum deviation). This way, this iterative process was able to generate the most accurate market numbers and qualitative insights.
Secondary research
The secondary research sources that are typically mentioned to include, but are not limited to:
The paid sources for secondary research like Factiva, OneSource, Hoovers, and Statista
Primary Research:
Primary research involves telephonic interviews, e-mail interactions, as well as face-to-face interviews for each market, category, segment, and subsegment across geographies
The contributors who typically take part in such a course include, but are not limited to:
Data Modeling and Analysis:
In the iterative process (mentioned above), data models received inputs from primary as well as secondary sources. But analysts working on these models were the key. They used their extensive knowledge and experience about industry and topic to make changes and fine-tuning these models as per the product/service under study.
The standard data models used while studying this market were the top-down and bottom-up approaches and the company shares analysis model. However, other methods were also used along with these – which were specific to the industry and product/service under study.
To know more about the research methodology used for this study, kindly contact us/click here.
