14.JPG)
Global Carbon Footprint Management Market Size is valued at USD 13.9 Billion in 2024 and is predicted to reach USD 112.0 Billion by the year 2034 at a 23.4% CAGR during the forecast period for 2025-2034.
Key Industry Insights & Findings from the Report:

The global carbon footprint management industry is expanding due to rising industrial energy consumption demands and the need for more sustainable energy sources. Also, the development of the carbon footprint management industry is being positively impacted by an increase in government activities and policies for low carbon policies. The carbon footprint management systems market may be constrained during the forecast period due to higher installation and maintenance expenses.
However, throughout the forecast period, the growing adoption of trends in advanced technologies, such as artificial intelligence, IoT, and big data, across sectors would present lucrative prospects for the carbon footprint management market growth.
The Carbon Footprint Management market is segmented on the basis of component, deployment mode, organization size, and vertical. Based on components, the market is segregated into solutions and services. The deployment mode segment comprises cloud and on-premises. By organization size, the market is segregated into corporates, mid-tier enterprises, and small businesses. The vertical segment includes manufacturing, energy & utilities, residential & commercial buildings, transportation & logistics, IT & telecom, Financial services, and government.
Due to advantages like cheap capital expenditures on onsite hardware, simple scalability, security, connection, and safety, cloud deployment is becoming more and more popular. For instance, Google Cloud announced a new function in October 2021 that allows users to create a personalized carbon footprint report. This new function intends to assist users in achieving their environmental objectives. Furthermore, compared to on-premises servers, the cloud is a greener option. In contrast to on-premises, which has a server utilization rate of only 15%, a large-scale cloud provider has a 65% rate. This suggests that fewer machines are in use, which decreases the amount of electricity needed. Consequently, the cloud is a resource-efficient and environmentally friendly alternative, which is advantageous for the global market for carbon footprint management.
Due to the carbon emissions produced by millions of automobiles, the transportation sector is anticipated to dominate the market over the forecast period. One of the primary sources of carbon emissions is the transportation sector. The personal automotive industry is the leading source of pollution in many nations. Investments in electric vehicles have increased as a result of more stringent government rules and efforts to cut carbon emissions. Because of this, the carbon footprint management market will probably grow. Furthermore, a number of options for reducing the environmental impact are offered by transportation management systems that combine planning and execution.
Since governments in the US actively consider the effects of rapid industrialization and the unstable production of carbon, which create substantial health and environmental issues harm, the North American region is predicted to have a significant share in the global carbon footprint market. A similar carbon tax, such as an energy tax, has already been imposed in a number of countries in this region (based on the carbon emission during the production of energy). According to a 2021 article from the Center for Climate and Energy Solutions, a nonprofit American environmental organization, thirty-five carbon tax projects have already been deployed across the region.
|
Report Attribute |
Specifications |
|
Market size value in 2024 |
USD 13.9 Billion |
|
Revenue forecast in 2034 |
USD 112.0 Billion |
|
Growth rate CAGR |
CAGR of 23.4% from 2025 to 2034 |
|
Quantitative units |
Representation of revenue in US$ Mn, and CAGR from 2025 to 2034 |
|
Historic Year |
2021 to 2024 |
|
Forecast Year |
2025-2034 |
|
Report coverage |
The forecast of revenue, the position of the company, the competitive market statistics, growth prospects, and trends |
|
Segments covered |
Component, Deployment Mode, Organization Size, And Vertical |
|
Regional scope |
North America; Europe; Asia Pacific; Latin America; Middle East & Africa |
|
Country scope |
U.S.; Canada; U.K.; Germany; China; India; Japan; Brazil; Mexico; The UK; France; Italy; Spain; China; Japan; India; South Korea; Southeast Asia; South Korea; Southeast Asia |
|
Competitive Landscape |
Schneider Electric, SAP, IBM, Salesforce, Isometrix, Enviance, Dakota Software, ESP, Accuvio, Locus Technologies, ProcessMap, NativeEnergy, Eco Track, Energy Cap, Carbon Footprint Ltd., Enablon, and Trinity Consultants. |
|
Customization scope |
Free customization report with the procurement of the report, Modifications to the regional and segment scope. Particular Geographic competitive landscape. |
|
Pricing and available payment methods |
Explore pricing alternatives that are customized to your particular study requirements. |
Chapter 1. Methodology and Scope
1.1. Research Methodology
1.2. Research Scope & Assumptions
Chapter 2. Executive Summary
Chapter 3. Global Carbon Footprint Management Market Snapshot
Chapter 4. Global Carbon Footprint Management Market Variables, Trends & Scope
4.1. Market Segmentation & Scope
4.2. Drivers
4.3. Challenges
4.4. Trends
4.5. Investment and Funding Analysis
4.6. Industry Analysis – Porter’s Five Forces Analysis
4.7. Competitive Landscape & Market Share Analysis
4.8. Impact of Covid-19 Analysis
Chapter 5. Market Segmentation 1: by Component Estimates & Trend Analysis
5.1. by Component & Market Share, 2024 & 2034
5.2. Market Size (Value (US$ Mn)) & Forecasts and Trend Analyses, 2021 to 2034 for the following by Component:
5.2.1. Solutions
5.2.2. Services
5.2.2.1. Consulting
5.2.2.2. Integration & Deployment
5.2.2.3. Support & Maintenance
Chapter 6. Market Segmentation 2: by Deployment Type Estimates & Trend Analysis
6.1. by Deployment Type & Market Share, 2024 & 2034
6.2. Market Size (Value (US$ Mn)) & Forecasts and Trend Analyses, 2021 to 2034 for the following by Deployment Type:
6.2.1. Cloud
6.2.2. On-Premises
Chapter 7. Market Segmentation 3: by Organization Size Estimates & Trend Analysis
7.1. by Organization Size & Market Share, 2024 & 2034
7.2. Market Size (Value (US$ Mn)) & Forecasts and Trend Analyses, 2021 to 2034 for the following by Organization Size:
7.2.1. Corporates/Enterprises
7.2.2. Mid-Tier Enterprises
7.2.3. Small Businesses
Chapter 8. Market Segmentation 4: by Vertical Estimates & Trend Analysis
8.1. by Vertical & Market Share, 2024 & 2034
8.2. Market Size (Value (US$ Mn)) & Forecasts and Trend Analyses, 2021 to 2034 for the following by Vertical:
8.2.1. Manufacturing
8.2.1.1. Food & Beverages
8.2.1.2. Metals & Mining
8.2.1.3. Chemical & Materials
8.2.1.4. Electronics & Consumer Goods
8.2.1.5. Automotive
8.2.1.6. Pharmaceutical & Healthcare
8.2.1.7. Others
8.2.2. Energy and Utilities
8.2.3. Residential and Commercial Buildings
8.2.4. Transportation and Logistics
8.2.5. IT and Telecom
8.2.6. Financial Services
8.2.7. Government
Chapter 9. Carbon Footprint Management Market Segmentation 5: Regional Estimates & Trend Analysis
9.1. North America
9.1.1. North America Carbon Footprint Management Market Revenue (US$ Million) Estimates and Forecasts by Component, 2021-2034
9.1.2. North America Carbon Footprint Management Market Revenue (US$ Million) Estimates and Forecasts by Deployment Type, 2021-2034
9.1.3. North America Carbon Footprint Management Market Revenue (US$ Million) Estimates and Forecasts by Organization Size, 2021-2034
9.1.4. North America Carbon Footprint Management Market Revenue (US$ Million) Estimates and Forecasts by Vertical, 2021-2034
9.1.5. North America Carbon Footprint Management Market Revenue (US$ Million) Estimates and Forecasts by country, 2021-2034
9.2. Europe
9.2.1. Europe Carbon Footprint Management Market Revenue (US$ Million) Estimates and Forecasts by Component, 2021-2034
9.2.2. Europe Carbon Footprint Management Market Revenue (US$ Million) Estimates and Forecasts by Deployment Type, 2021-2034
9.2.3. Europe Carbon Footprint Management Market Revenue (US$ Million) Estimates and Forecasts by Organization Size, 2021-2034
9.2.4. Europe Carbon Footprint Management Market Revenue (US$ Million) Estimates and Forecasts by Vertical, 2021-2034
9.2.5. Europe Carbon Footprint Management Market Revenue (US$ Million) Estimates and Forecasts by country, 2021-2034
9.3. Asia Pacific
9.3.1. Asia Pacific Carbon Footprint Management Market Revenue (US$ Million) Estimates and Forecasts by Component, 2021-2034
9.3.2. Asia Pacific Carbon Footprint Management Market Revenue (US$ Million) Estimates and Forecasts by Deployment Type, 2021-2034
9.3.3. Asia-Pacific Carbon Footprint Management Market Revenue (US$ Million) Estimates and Forecasts by Organization Size, 2021-2034
9.3.4. Asia-Pacific Carbon Footprint Management Market Revenue (US$ Million) Estimates and Forecasts by Vertical, 2021-2034
9.3.5. Asia Pacific Carbon Footprint Management Market Revenue (US$ Million) Estimates and Forecasts by country, 2021-2034
9.4. Latin America
9.4.1. Latin America Carbon Footprint Management Market Revenue (US$ Million) Estimates and Forecasts by Component, 2021-2034
9.4.2. Latin America Carbon Footprint Management Market Revenue (US$ Million) Estimates and Forecasts by Deployment Type, 2021-2034
9.4.3. Latin America Carbon Footprint Management Market Revenue (US$ Million) Estimates and Forecasts by Organization Size, 2021-2034
9.4.4. Latin America Carbon Footprint Management Market Revenue (US$ Million) Estimates and Forecasts by Vertical, 2021-2034
9.4.5. Latin America Carbon Footprint Management Market Revenue (US$ Million) Estimates and Forecasts by country, 2021-2034
9.5. Middle East & Africa
9.5.1. Middle East & Africa Carbon Footprint Management Market Revenue (US$ Million) Estimates and Forecasts by Component, 2021-2034
9.5.2. Middle East & Africa Carbon Footprint Management Market Revenue (US$ Million) Estimates and Forecasts by Deployment Type, 2021-2034
9.5.3. Middle East & Africa Carbon Footprint Management Market Revenue (US$ Million) Estimates and Forecasts by Organization Size, 2021-2034
9.5.4. Middle East & Africa Carbon Footprint Management Market Revenue (US$ Million) Estimates and Forecasts by Vertical, 2021-2034
9.5.5. Middle East & Africa Carbon Footprint Management Market Revenue (US$ Million) Estimates and Forecasts by country, 2021-2034
Chapter 10. Competitive Landscape
10.1. Major Mergers and Acquisitions/Strategic Alliances
10.2. Company Profiles
10.2.1. Accuvio Sustainability Reporting Software
10.2.2. Carbon EMS
10.2.3. Carbon Footprint Ltd.
10.2.4. Dakota Software Corporation
10.2.5. Eco Track
10.2.6. Enablon
10.2.7. EnergyCAP, Inc.
10.2.8. ENGIE
10.2.9. Enviance
10.2.10. Envirosoft Corporation
10.2.11. ESP
10.2.12. IBM Corporation
10.2.13. Intelex Technologies ULC
10.2.14. IsoMetrix Software
10.2.15. Laragon Sustainability Solutions
10.2.16. Locus Technologies
10.2.17. NativeEnergy
10.2.18. ProcessMAP Corporation
10.2.19. Salesforce
10.2.20. SAP
10.2.21. Schneider Electric
10.2.22. Trinity Consultants
10.2.23. Wolters Kluwer N.V.
10.2.24. Other Prominent Players
Carbon Footprint Management Market By Component-

Carbon Footprint Management Market By Deployment Mode-
Carbon Footprint Management Market By Organization Size-
Carbon Footprint Management Market By Vertical-
Carbon Footprint Management Market By Region-
North America-
Europe-
Asia-Pacific-
Latin America-
Middle East & Africa-
InsightAce Analytic follows a standard and comprehensive market research methodology focused on offering the most accurate and precise market insights. The methods followed for all our market research studies include three significant steps – primary research, secondary research, and data modeling and analysis - to derive the current market size and forecast it over the forecast period. In this study, these three steps were used iteratively to generate valid data points (minimum deviation), which were cross-validated through multiple approaches mentioned below in the data modeling section.
Through secondary research methods, information on the market under study, its peer, and the parent market was collected. This information was then entered into data models. The resulted data points and insights were then validated by primary participants.
Based on additional insights from these primary participants, more directional efforts were put into doing secondary research and optimize data models. This process was repeated till all data models used in the study produced similar results (with minimum deviation). This way, this iterative process was able to generate the most accurate market numbers and qualitative insights.
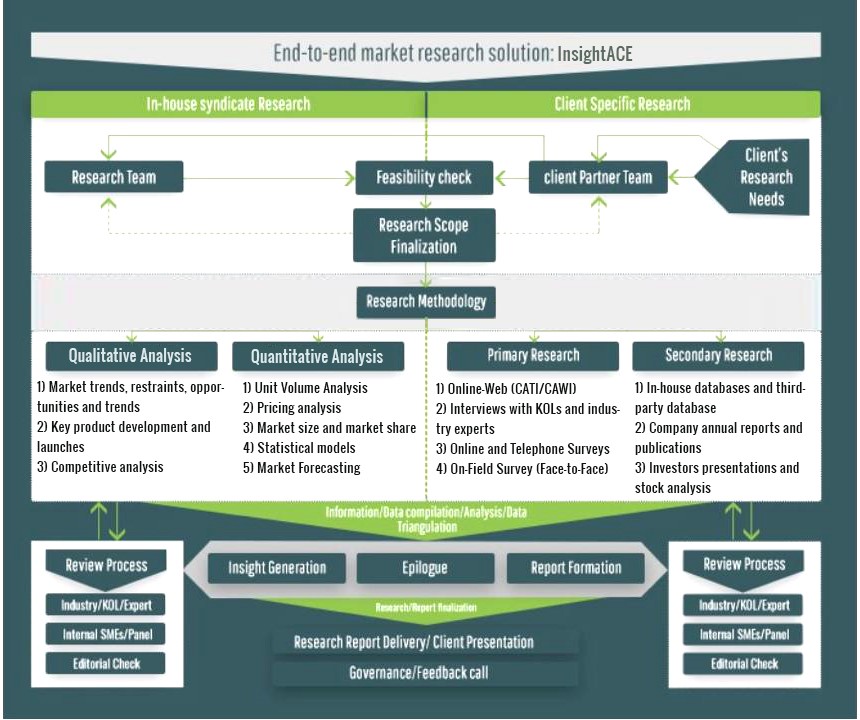
Secondary research
The secondary research sources that are typically mentioned to include, but are not limited to:
The paid sources for secondary research like Factiva, OneSource, Hoovers, and Statista
Primary Research:
Primary research involves telephonic interviews, e-mail interactions, as well as face-to-face interviews for each market, category, segment, and subsegment across geographies
The contributors who typically take part in such a course include, but are not limited to:
Data Modeling and Analysis:
In the iterative process (mentioned above), data models received inputs from primary as well as secondary sources. But analysts working on these models were the key. They used their extensive knowledge and experience about industry and topic to make changes and fine-tuning these models as per the product/service under study.
The standard data models used while studying this market were the top-down and bottom-up approaches and the company shares analysis model. However, other methods were also used along with these – which were specific to the industry and product/service under study.
To know more about the research methodology used for this study, kindly contact us/click here.
