
The Carbon Capture, Utilization, and Storage Market Size is valued at USD 3.84 Bn in 2023 and is predicted to reach USD 17.37 Bn by the year 2031 at an 21.2% CAGR during the forecast period for 2024-2031.

The Carbon Capture, Utilization, and Storage (CCUS) market is vital in the global effort to reduce CO2 emissions from industrial processes and power generation. CCUS integrates three main processes: capturing CO2 emissions at their source using techniques like post-combustion, pre-combustion, and direct air capture; utilizing the captured CO2 in various applications such as producing chemicals, fuels, and construction materials; and transporting the CO2 for long-term storage in geological formations to prevent its release into the atmosphere. This approach not only mitigates climate change but also creates economic opportunities through the monetization of captured carbon.
The applications of CCUS are diverse, including enhanced oil recovery in the oil and gas sector, reducing emissions in power plants, and targeting significant emitters like the cement and steel industries. Captured CO2 can also be used in chemical production, promoting a circular carbon economy. The CCUS market's growth is driven by increasing global efforts to reduce greenhouse gas emissions, with governments implementing stringent regulations and policies aimed at carbon neutrality. Rising awareness of climate change impacts and regulatory support are propelling investments in CCUS technologies, as industries strive to adopt more sustainable practices and comply with environmental regulations.
The carbon capture, utilization, and storage market is segmented by service, technology, and end-use industry. By service the market is segmented into capture, transportation, utilization, storage, by technology market is categorized into pre-combustion carbon capture, post-combustion carbon capture, oxy-fuel combustion carbon capture. By end-use industry market is categorized into oil and gas industry, power industry, others (cement industry, chemical industry, iron & steel).
The Capture segment is the largest and a key driver of the Carbon Capture, Utilization, and Storage (CCUS) market due to its foundational role in the CCUS process. Capture involves isolating CO2 emissions from industrial sources and power generation before they enter the atmosphere, making it crucial for the success of subsequent transportation, utilization, and storage steps. Its broad applicability across diverse emission sources, such as coal-fired power plants and industrial processes like cement and steel production, ensures a steady demand for capture solutions. Moreover, ongoing technological advancements in post-combustion, pre-combustion, and direct air capture methods are improving efficiency and reducing costs, attracting investments and facilitating compliance with stringent environmental regulations. These factors collectively highlight the Capture segment’s critical importance and its substantial contribution to the growth of the CCUS market.
The Post-Combustion Carbon Capture segment is the largest and fastest growing in the CCUS market due to its proven effectiveness and broad applicability. This mature technology captures CO2 from flue gases after fossil fuels are burned, using established methods like solvent-based absorption. It can be retrofitted to existing infrastructure across various emission sources, including coal-fired power plants and industrial processes. With capture rates exceeding 90%, post-combustion capture offers high efficiency in reducing greenhouse gases, making it a preferred choice for industries aiming to meet stringent emissions regulations.
The U.S. leads globally in carbon capture capacity used in enhanced oil recovery (EOR), handling about 30 million metric tons annually, which significantly drives CCUS adoption in North America. Government incentives like the FUTURE Act provide tax credits for carbon capture projects, enhancing financial viability and investment. The presence of key players such as ExxonMobil, Fluor Corporation, Halliburton, and Schlumberger further stimulates innovation and deployment. Increasing demand for clean technologies and the maturity of the CCUS industry, with decades of commercial deployment in the oil and gas sector, offer North America established infrastructure, expertise, and economies of scale.
|
Report Attribute |
Specifications |
|
Market Size Value In 2022 |
USD 3.84 Bn |
|
Revenue Forecast In 2031 |
USD 17.37 Bn |
|
Growth Rate CAGR |
CAGR of 21.2 % from 2024 to 2031 |
|
Quantitative Units |
Representation of revenue in US$ Bn and CAGR from 2024 to 2031 |
|
Historic Year |
2019 to 2023 |
|
Forecast Year |
2024-2031 |
|
Units considered |
Value (USD Million/Billion), Volume (ton) |
|
Report Coverage |
The forecast of revenue, the position of the company, the competitive market structure, growth prospects, and trends |
|
Segments Covered |
By Service, By Technology, By End-Use Industry and By Region |
|
Regional Scope |
North America; Europe; Asia Pacific; Latin America; Middle East & Africa |
|
Country Scope |
U.S.; Canada; U.K.; Germany; China; India; Japan; Brazil; Mexico; The UK; France; Italy; Spain; China; Japan; India; South Korea; Southeast Asia; South Korea; Southeast Asia |
|
Competitive Landscape |
Aker Carbon Capture, Carbon Clean Solutions Limited, CarbonFree, C-Capture, Cemvita Factory Inc., Equinor ASA, ExxonMobil Corporation, Fluor Corporation, Halliburton, Hitachi, Ltd, Honeywell International Inc, JGC Holdings Corporation, Linde Plc, Mirreco, Mitsubishi Heavy Industries, Ltd., Neustark AG, Royal Dutch Shell, Schlumberger Ltd, SeeO2 Energy Inc., Shell plc, Siemens |
|
Customization Scope |
Free customization report with the procurement of the report, Modifications to the regional and segment scope. Geographic competitive landscape. |
|
Pricing and Available Payment Methods |
Explore pricing alternatives that are customized to your particular study requirements. |
Chapter 1. Methodology and Scope
1.1. Research Methodology
1.2. Research Scope & Assumptions
Chapter 2. Executive Summary
Chapter 3. Global Carbon Capture, Utilization, and Storage Market Snapshot
Chapter 4. Global Carbon Capture, Utilization, and Storage Market Variables, Trends & Scope
4.1. Market Segmentation & Scope
4.2. Drivers
4.3. Challenges
4.4. Trends
4.5. Investment and Funding Analysis
4.6. Industry Analysis – Porter’s Five Forces Analysis
4.7. Competitive Landscape & Market Share Analysis
4.8. Impact of Covid-19 Analysis
Chapter 5. Market Segmentation 1: by Service Estimates & Trend Analysis
5.1. by Service & Market Share, 2019 & 2031
5.2. Market Size (Value (US$ Mn) & Volume (Ton)) & Forecasts and Trend Analyses, 2019 to 2031 for the following by Service:
5.2.1. Capture
5.2.2. Transportation
5.2.3. Utilization
5.2.4. Storage
Chapter 6. Market Segmentation 2: by Technology Estimates & Trend Analysis
6.1. by Technology & Market Share, 2019 & 2031
6.2. Market Size (Value (US$ Mn) & Volume (Ton)) & Forecasts and Trend Analyses, 2019 to 2031 for the following by Technology:
6.2.1. Pre-Combustion Carbon Capture
6.2.2. Post-Combustion Carbon Capture
6.2.3. Oxy-Fuel Combustion Carbon Capture
Chapter 7. Market Segmentation 3: by End-Use Industry Estimates & Trend Analysis
7.1. by End-Use Industry & Market Share, 2019 & 2031
7.2. Market Size (Value (US$ Mn) & Volume (Ton)) & Forecasts and Trend Analyses, 2019 to 2031 for the following by End-Use Industry:
7.2.1. Oil and Gas Industry
7.2.2. Power Industry
7.2.3. Iron & Steel
7.2.4. Others
7.2.4.1. Cement Industry
7.2.4.2. Chemical Industry
Chapter 8. Carbon Capture, Utilization, and Storage Market Segmentation 4: Regional Estimates & Trend Analysis
8.1. North America
8.1.1. North America Carbon Capture, Utilization, and Storage Market Revenue (US$ Million) & Volume (Ton) Estimates and Forecasts by Service, 2024-2031
8.1.2. North America Carbon Capture, Utilization, and Storage Market Revenue (US$ Million) & Volume (Ton) Estimates and Forecasts by Technology, 2024-2031
8.1.3. North America Carbon Capture, Utilization, and Storage Market Revenue (US$ Million) & Volume (Ton) Estimates and Forecasts by End-Use Industry, 2024-2031
8.1.4. North America Carbon Capture, Utilization, and Storage Market Revenue (US$ Million) & Volume (Ton) Estimates and Forecasts by country, 2024-2031
8.2. Europe
8.2.1. Europe Carbon Capture, Utilization, and Storage Market Revenue (US$ Million) & Volume (Ton) Estimates and Forecasts by Service, 2024-2031
8.2.2. Europe Carbon Capture, Utilization, and Storage Market Revenue (US$ Million) & Volume (Ton) Estimates and Forecasts by Technology, 2024-2031
8.2.3. Europe Carbon Capture, Utilization, and Storage Market Revenue (US$ Million) & Volume (Ton) Estimates and Forecasts by End-Use Industry, 2024-2031
8.2.4. Europe Carbon Capture, Utilization, and Storage Market Revenue (US$ Million) & Volume (Ton) Estimates and Forecasts by country, 2024-2031
8.3. Asia Pacific
8.3.1. Asia Pacific Carbon Capture, Utilization, and Storage Market Revenue (US$ Million) & Volume (Ton) Estimates and Forecasts by Service, 2024-2031
8.3.2. Asia Pacific Carbon Capture, Utilization, and Storage Market Revenue (US$ Million) & Volume (Ton) Estimates and Forecasts by Technology, 2024-2031
8.3.3. Asia-Pacific Carbon Capture, Utilization, and Storage Market Revenue (US$ Million) & Volume (Ton) Estimates and Forecasts by End-Use Industry, 2024-2031
8.3.4. Asia Pacific Carbon Capture, Utilization, and Storage Market Revenue (US$ Million) & Volume (Ton) Estimates and Forecasts by country, 2024-2031
8.4. Latin America
8.4.1. Latin America Carbon Capture, Utilization, and Storage Market Revenue (US$ Million) & Volume (Ton) Estimates and Forecasts by Service, 2024-2031
8.4.2. Latin America Carbon Capture, Utilization, and Storage Market Revenue (US$ Million) & Volume (Ton) Estimates and Forecasts by Technology, 2024-2031
8.4.3. Latin America Carbon Capture, Utilization, and Storage Market Revenue (US$ Million) & Volume (Ton) Estimates and Forecasts by End-Use Industry, 2024-2031
8.4.4. Latin America Carbon Capture, Utilization, and Storage Market Revenue (US$ Million) & Volume (Ton) Estimates and Forecasts by country, 2024-2031
8.5. Middle East & Africa
8.5.1. Middle East & Africa Carbon Capture, Utilization, and Storage Market Revenue (US$ Million) & Volume (Ton) Estimates and Forecasts by Service, 2024-2031
8.5.2. Middle East & Africa Carbon Capture, Utilization, and Storage Market Revenue (US$ Million) & Volume (Ton) Estimates and Forecasts by Technology, 2024-2031
8.5.3. Middle East & Africa Carbon Capture, Utilization, and Storage Market Revenue (US$ Million) & Volume (Ton) Estimates and Forecasts by End-Use Industry, 2024-2031
8.5.4. Middle East & Africa Carbon Capture, Utilization, and Storage Market Revenue (US$ Million) & Volume (Ton) Estimates and Forecasts by country, 2024-2031
Chapter 9. Competitive Landscape
9.1. Major Mergers and Acquisitions/Strategic Alliances
9.2. Company Profiles
9.2.1. Aker Carbon Capture
9.2.2. Carbon Clean Solutions Limited
9.2.3. CarbonFree
9.2.4. C-Capture
9.2.5. Cemvita Factory Inc.
9.2.6. Equinor ASA
9.2.7. ExxonMobil Corporation
9.2.8. Fluor Corporation
9.2.9. Halliburton
9.2.10. Hitachi, Ltd
9.2.11. Honeywell International Inc
9.2.12. JGC Holdings Corporation
9.2.13. Linde Plc
9.2.14. Mirreco
9.2.15. Mitsubishi Heavy Industries, Ltd.
9.2.16. Neustark AG
9.2.17. Royal Dutch Shell
9.2.18. Schlumberger Ltd
9.2.19. SeeO2 Energy Inc.
9.2.20. Shell plc
9.2.21. Siemens
9.2.22. Other Prominent Players
Carbon Capture, Utilization, and Storage Market by Service -

Carbon Capture, Utilization, and Storage Market by Technology -
Carbon Capture, Utilization, and Storage Market by End-Use Industry-
Carbon Capture, Utilization, and Storage Market by Region-
North America-
Europe-
Asia-Pacific-
Latin America-
Middle East & Africa-
InsightAce Analytic follows a standard and comprehensive market research methodology focused on offering the most accurate and precise market insights. The methods followed for all our market research studies include three significant steps – primary research, secondary research, and data modeling and analysis - to derive the current market size and forecast it over the forecast period. In this study, these three steps were used iteratively to generate valid data points (minimum deviation), which were cross-validated through multiple approaches mentioned below in the data modeling section.
Through secondary research methods, information on the market under study, its peer, and the parent market was collected. This information was then entered into data models. The resulted data points and insights were then validated by primary participants.
Based on additional insights from these primary participants, more directional efforts were put into doing secondary research and optimize data models. This process was repeated till all data models used in the study produced similar results (with minimum deviation). This way, this iterative process was able to generate the most accurate market numbers and qualitative insights.
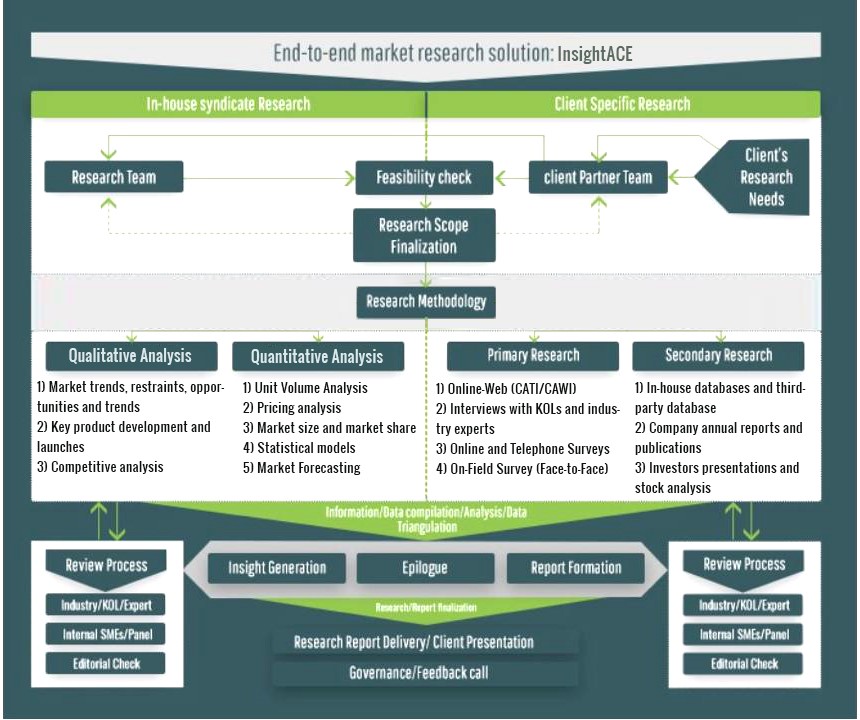
Secondary research
The secondary research sources that are typically mentioned to include, but are not limited to:
The paid sources for secondary research like Factiva, OneSource, Hoovers, and Statista
Primary Research:
Primary research involves telephonic interviews, e-mail interactions, as well as face-to-face interviews for each market, category, segment, and subsegment across geographies
The contributors who typically take part in such a course include, but are not limited to:
Data Modeling and Analysis:
In the iterative process (mentioned above), data models received inputs from primary as well as secondary sources. But analysts working on these models were the key. They used their extensive knowledge and experience about industry and topic to make changes and fine-tuning these models as per the product/service under study.
The standard data models used while studying this market were the top-down and bottom-up approaches and the company shares analysis model. However, other methods were also used along with these – which were specific to the industry and product/service under study.
