
Global Returnable Plastic Crate Market Size is valued at USD 1.7 Bn in 2024 and is predicted to reach USD 2.9 Bn by the year 2034 at a 5.2% CAGR during the forecast period for 2025-2034.
Returnable containers have emerged as a solution that effectively meets transportation requirements and significantly reduces losses in complex supply chain networks. Consequently, the returnable plastic crates are expected to become more popular during the projection period due to urbanization. Storage plastic crates, which are available in a variety of sizes and patterns, are an alternative to traditional wooden boxes. Reusable packaging as a service is one of the primary causes driving the rise of the returnable plastic crate market.

Some organizations provide reusable packaging as a service, managing the whole lifetime of returnable plastic crates for enterprises and easing the load of maintenance and management for end users. However, lockdowns and restrictions disrupted supply systems all around the world. This could have had an impact on RPC return and reuse logistics, causing disruptions in their intended cycle. Economic insecurity and downturns in numerous industries may have prompted some organizations to decrease expenditures, thus hurting investments in reusable packaging solutions such as RPCs.
The Returnable Plastic Crate Market is segmented as capacity, product type, material, and application. As per the capacity, the market is segmented as less than 10 kg, 10 kg to 20 kg, 21 to 35 kg, 36 to 50 kg, and above 50 kg. The product type segment includes stackable, nestable, and collapsible. By material, the market is segmented into high-density polyethene (HDPE), polypropylene (P.P.), and others. The applications segment includes agriculture, grocery, dairy, bakery, seafood & meat, and others.
The nestable category is expected to hold a major share of the global Returnable Plastic Crate Market in 2024. Nestable boxes save a lot of space. They can be nested or stacked inside one another while not in use, minimizing the amount of storage space necessary, which is especially useful in warehouses, distribution centres, and during return transit. Nestable crates' space efficiency results in cost savings in storage and transportation. Lower warehouse expenses result from reduced storage space requirements, and the capacity to stack more crates on a single pallet results in lower shipping costs. Nestable containers make supply chain and logistical operations more efficient.
The High-density polyethene segment is projected to grow at a rapid rate in the global Returnable Plastic Crate Market. Because of its great durability, HDPE is ideal for applications requiring long-lasting and durable packaging solutions. HDPE boxes can withstand hard handling and safeguard the products being transported. Because HDPE is extremely recyclable, it is an environmentally friendly alternative. Businesses and industries are increasingly choosing packaging solutions produced from recycled HDPE or recyclable after use. HDPE crates with insulating qualities can be created, making them useful for temperature-regulated logistics, such as the delivery of medications and perishable items. HDPE crates can be customized with company logos and product information as a marketing tool during transit and in-store displays. The use of HDPE in returnable plastic crates is consistent with environmental objectives and efforts to reduce waste.
Europe's Returnable Plastic Crate Market is expected to record the maximum market share in revenue in the near future. Europe has been a leader in environmental sustainability efforts, and there is a significant push to reduce single-use plastics. RPCs are compatible with the region's environmental goals because they are reusable and recyclable. The emphasis in Europe on efficient and sustainable supply chains pushes the deployment of RPCs. With their stackable and robust construction, these boxes help to streamline logistics and reduce environmental impact. Asia-Pacific, on the other hand, is expected to demonstrate profitable growth during the forecast period due to the region's higher concentration of prominence, expanding investment for research and development capabilities, and rising standard of living.
|
Report Attribute |
Specifications |
|
Market Size Value In 2024 |
USD 1.7 Bn |
|
Revenue Forecast In 2034 |
USD 2.9 Bn |
|
Growth Rate CAGR |
CAGR of 5.2% from 2025 to 2034 |
|
Quantitative Units |
Representation of revenue in US$ Bn, Volume (Unit) and CAGR from 2025 to 2034 |
|
Historic Year |
2021 to 2024 |
|
Forecast Year |
2025-2034 |
|
Report Coverage |
The forecast of revenue, the position of the company, the competitive market structure, growth prospects, and trends |
|
Segments Covered |
By Capacity, By Product Type, By Material, By Application |
|
Regional Scope |
North America; Europe; Asia Pacific; Latin America; Middle East & Africa |
|
Country Scope |
U.S.; Canada; U.K.; Germany; China; India; Japan; Brazil; Mexico; France; Italy; Spain; South East Asia; South Korea |
|
Competitive Landscape |
Brambles Limited, Myers Industries Inc., Supreme Industries Limited, DS Smith PLC, Schoeller Allibert Services B.V., Rehrig Pacific Company Inc., TranPak Inc., IPL Plastics Inc., RPP Containers, Craemer UK Limited, Dynawest Limited, Dolav UK Limited, Ravensbourn Limited, Zhejiang Zhengji Plastic Industry Co. Ltd., Stamford Products Limited., Others |
|
Customization Scope |
Free customization report with the procurement of the report and modifications to the regional and segment scope. Particular Geographic competitive landscape. |
|
Pricing And Available Payment Methods |
Explore pricing alternatives that are customized to your particular study requirements. |
Chapter 1. Methodology and Scope
1.1. Research Methodology
1.2. Research Scope & Assumptions
Chapter 2. Executive Summary
Chapter 3. Global Returnable Plastic Crate Market Snapshot
Chapter 4. Global Returnable Plastic Crate Market Variables, Trends & Scope
4.1. Market Segmentation & Scope
4.2. Drivers
4.3. Challenges
4.4. Trends
4.5. Investment and Funding Analysis
4.6. Industry Analysis – Porter’s Five Forces Analysis
4.7. Competitive Landscape & Market Share Analysis
4.8. Impact of Covid-19 Analysis
Chapter 5. Market Segmentation 1: By Product Type Estimates & Trend Analysis
5.1. By Product Type, & Market Share, 2024 & 2034
5.2. Market Size (Value US$ Mn & Volume (Unit)) & Forecasts and Trend Analyses, 2021 20 to 2034 for the following By Product Type:
5.2.1. Stackable
5.2.2. Nestable
5.2.3. Collapsible
Chapter 6. Market Segmentation 2: By Application Estimates & Trend Analysis
6.1. By Application & Market Share, 2024 & 2034
6.2. Market Size (Value US$ Mn & Volume (Unit)) & Forecasts and Trend Analyses, 2021 to 2034 for the following By Application:
6.2.1. Agriculture
6.2.2. Grocery
6.2.3. Dairy
6.2.4. Bakery
6.2.5. Seafood & Meat
6.2.6. Others
Chapter 7. Market Segmentation 3: By Material Estimates & Trend Analysis
7.1. By Material & Market Share, 2024 & 2034
7.2. Market Size (Value US$ Mn & Volume (Unit)) & Forecasts and Trend Analyses, 2021 to 2034 for the following By Material:
7.2.1. High Density Polyethylene (HDPE)
7.2.2. Polypropylene (PP)
7.2.3. Others
Chapter 8. Market Segmentation 4: By Capacity Estimates & Trend Analysis
8.1. By Capacity & Market Share, 2024 & 2034
8.2. Market Size (Value US$ Mn & Volume (Unit)) & Forecasts and Trend Analyses, 2021 to 2034 for the following By Capacity:
8.2.1. Less than 10 Kg
8.2.2. 10 Kg to 20 Kg
8.2.3. 21 Kg to 35 Kg
8.2.4. 36 Kg to 50 Kg
8.2.5. Above 50 Kg
Chapter 9. Returnable Plastic Crate Market Segmentation 5: Regional Estimates & Trend Analysis
9.1. North America
9.1.1. North America Returnable Plastic Crate Market revenue (US$ Million) & Volume (Unit) estimates and forecasts By Product Type, 2021-2034
9.1.2. North America Returnable Plastic Crate Market revenue (US$ Million) & Volume (Unit) estimates and forecasts By Application, 2021-2034
9.1.3. North America Returnable Plastic Crate Market revenue (US$ Million) & Volume (Unit) estimates and forecasts By Material, 2021-2034
9.1.4. North America Returnable Plastic Crate Market revenue (US$ Million) & Volume (Unit) estimates and forecasts By Capacity, 2021-2034
9.1.5. North America Returnable Plastic Crate Market revenue (US$ Million) & Volume (Unit) estimates and forecasts by country, 2021-2034
9.2. Europe
9.2.1. Europe Returnable Plastic Crate Market revenue (US$ Million) & Volume (Unit) By Product Type, 2021-2034
9.2.2. Europe Returnable Plastic Crate Market revenue (US$ Million) & Volume (Unit) By Application, 2021-2034
9.2.3. Europe Returnable Plastic Crate Market revenue (US$ Million) & Volume (Unit) By Material, 2021-2034
9.2.4. Europe Returnable Plastic Crate Market revenue (US$ Million) & Volume (Unit) By Capacity, 2021-2034
9.2.5. Europe Returnable Plastic Crate Market revenue (US$ Million) & Volume (Unit) by country, 2021-2034
9.3. Asia Pacific
9.3.1. Asia Pacific Returnable Plastic Crate Market revenue (US$ Million) & Volume (Unit) By Product Type, 2021-2034
9.3.2. Asia Pacific Returnable Plastic Crate Market revenue (US$ Million) & Volume (Unit) By Application, 2021-2034
9.3.3. Asia Pacific Returnable Plastic Crate Market revenue (US$ Million) & Volume (Unit) By Material, 2021-2034
9.3.4. Asia Pacific Returnable Plastic Crate Market revenue (US$ Million) & Volume (Unit) By Capacity, 2021-2034
9.3.5. Asia Pacific Returnable Plastic Crate Market revenue (US$ Million) & Volume (Unit) by country, 2021-2034
9.4. Latin America
9.4.1. Latin America Returnable Plastic Crate Market revenue (US$ Million) & Volume (Unit) By Product Type, (US$ Million) 2021-2034
9.4.2. Latin America Returnable Plastic Crate Market revenue (US$ Million) & Volume (Unit) By Application, (US$ Million) 2021-2034
9.4.3. Latin America Returnable Plastic Crate Market revenue (US$ Million) & Volume (Unit) By Material, (US$ Million) 2021-2034
9.4.4. Latin America Returnable Plastic Crate Market revenue (US$ Million) & Volume (Unit) By Capacity, (US$ Million) 2021-2034
9.4.5. Latin America Returnable Plastic Crate Market revenue (US$ Million) & Volume (Unit) by country, 2021-2034
9.5. Middle East & Africa
9.5.1. Middle East & Africa Returnable Plastic Crate Market revenue (US$ Million) & Volume (Unit) By Product Type, (US$ Million) 2021-2034
9.5.2. Middle East & Africa Returnable Plastic Crate Market revenue (US$ Million) & Volume (Unit) By Application, (US$ Million) 2021-2034
9.5.3. Middle East & Africa Returnable Plastic Crate Market revenue (US$ Million) & Volume (Unit) By Material, (US$ Million) 2021-2034
9.5.4. Middle East & Africa Returnable Plastic Crate Market revenue (US$ Million) & Volume (Unit) By Capacity, (US$ Million) 2021-2034
9.5.5. Middle East & Africa Returnable Plastic Crate Market revenue (US$ Million) & Volume (Unit) by country, 2021-2034
Chapter 10. Competitive Landscape
10.1. Major Mergers and Acquisitions/Strategic Alliances
10.2. Company Profiles
10.2.1. Brambles Limited
10.2.2. Myers Industries Inc.
10.2.3. Supreme Industries Limited
10.2.4. Schoeller Allibert Services B.V.
10.2.5. DS Smith PLC
10.2.6. Rehrig Pacific Company Inc.
10.2.7. TranPak Inc.
10.2.8. IPL Plastics Inc.
10.2.9. RPP Containers
10.2.10. Craemer UK Limited
10.2.11. Dynawest Limited
10.2.12. Dolav UK Limited
10.2.13. Ravensbourn Limited
10.2.14. Zhejiang Zhengji Plastic Industry Co. Ltd.
10.2.15. Stamford Products Limited.
By Capacity-

By Product Type-
By Material-
By Application-
By Region-
North America-
Europe-
Asia-Pacific-
Latin America-
Middle East & Africa-
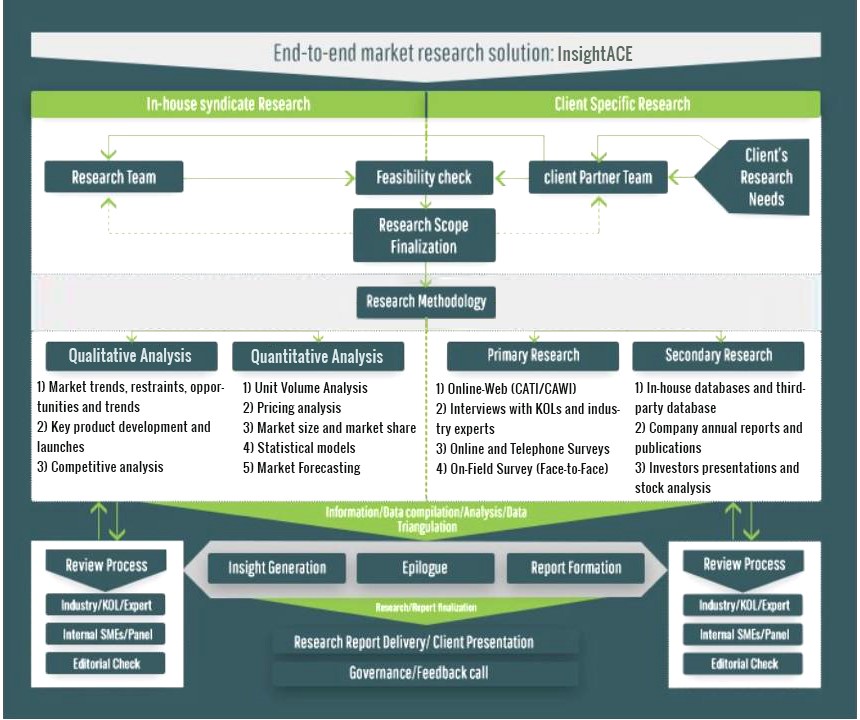
InsightAce Analytic follows a standard and comprehensive market research methodology focused on offering the most accurate and precise market insights. The methods followed for all our market research studies include three significant steps – primary research, secondary research, and data modeling and analysis - to derive the current market size and forecast it over the forecast period. In this study, these three steps were used iteratively to generate valid data points (minimum deviation), which were cross-validated through multiple approaches mentioned below in the data modeling section.
Through secondary research methods, information on the market under study, its peer, and the parent market was collected. This information was then entered into data models. The resulted data points and insights were then validated by primary participants.
Based on additional insights from these primary participants, more directional efforts were put into doing secondary research and optimize data models. This process was repeated till all data models used in the study produced similar results (with minimum deviation). This way, this iterative process was able to generate the most accurate market numbers and qualitative insights.
Secondary research
The secondary research sources that are typically mentioned to include, but are not limited to:
The paid sources for secondary research like Factiva, OneSource, Hoovers, and Statista
Primary Research:
Primary research involves telephonic interviews, e-mail interactions, as well as face-to-face interviews for each market, category, segment, and subsegment across geographies
The contributors who typically take part in such a course include, but are not limited to:
Data Modeling and Analysis:
In the iterative process (mentioned above), data models received inputs from primary as well as secondary sources. But analysts working on these models were the key. They used their extensive knowledge and experience about industry and topic to make changes and fine-tuning these models as per the product/service under study.
The standard data models used while studying this market were the top-down and bottom-up approaches and the company shares analysis model. However, other methods were also used along with these – which were specific to the industry and product/service under study.
To know more about the research methodology used for this study, kindly contact us/click here.
