
Global E-Waste Management Market Size is valued at USD 19.5 Billion in 2024 and is predicted to reach USD 74.1 Billion by the year 2034 at a 14.4% CAGR during the forecast period for 2025-2034.
Key Industry Insights & Findings from the Report:

E-waste is discarded electrical or electronic equipment. This includes both working and damaged items tossed in the waste or contributed to a charity merchant such as Goodwill. Increasing health risks, such as pneumonia, renal damage, and Wilson's disease, exacerbate the need for effective scrap management techniques. Additionally, the availability of precious metals such as gold, silver, platinum, and gallium makes electronic scrap recycling an appealing and realistic choice. These elements are expected to have a beneficial impact on market growth. Furthermore, the growing middle-income population in developing nations, combined with altering consumer preferences, is causing the quick replacement of older versions of electronic products with newer versions.
However, the COVID-19 pandemic had a wide-ranging impact on social lives, highlighting the interdependence of the world's environmental and community systems. The COVID-19 pandemic had a wide-ranging impact on social dynamism, emphasizing the interdependence of the world's ecological and assembly systems. Lockdowns and halts in industry and trade movements were implemented to prevent the spread of the virus across society, resulting in a fall in economic growth, mobility restrictions, and increased demand for digitization and quarantine in homes.
The E-waste management market is segmented on the processed material, source, and application. Based on Processed Material, the market is segmented as metal, plastic, glass, others. Based on source, the market is segmented into Industrial Electronics (IT & Telecom Equipment, Datacenters, Networking Cards/Equipment, Digital Boards, Others, Medical Equipment, Monitoring and Control Equipment, Others), Consumer Electronics (Household Appliances – Refrigerator, Television, Others; Handheld Electronics – Smartphones, Tablets, Wearables, Others; IT Accessories – Keyboards, Mice, Laptop Cases, USB Memory Sticks, Others; IT Equipment – Desktops, Laptops, Netbooks, Others; PCBs – High-grade, Medium-grade, Low-grade), Others. The application segment includes disposal (Reuse, Landfill, Incineration) and recycle.
Based on type, the market is segmented into metal, plastic, glass, others. Among these, the plastic segment dominates the MRD detection market due to its extensive use in consumables such as assay plates, tubes, pipette tips, and cartridge systems. Its affordability, disposability, and versatility make it the material of choice for both manual and automated MRD workflows. In contrast, metals like steel and copper are mainly used in durable parts of diagnostic instruments and account for a smaller market share due to infrequent replacement.
Based on source, the market is segmented into industrial electronics, consumer electronics and other, among these, industrial electronics segment witnessed growth at a rapid rate. The Industrial Electronics segment dominates the MRD detection market, as it encompasses the specialized and high-precision equipment used in clinical laboratories, hospitals, and research institutions. Instruments such as flow cytometers, PCR analyzers, and next-generation sequencing systems fall under this category and are essential for accurate and reliable MRD detection. In contrast, consumer electronics have little to no role in this field, as MRD testing requires advanced, regulated equipment that is not suited for personal or home use.
Asia Pacific E-waste management market is expected to register the highest market share in terms of revenue in the near future. Increasing disposable income in developed and developing nations, combined with an increased preference for electronic gadgets, is one of the primary development drivers for the region's industry. Furthermore, developed countries such as the United States and the United Kingdom export a considerable amount of e-waste to Asian countries, which is expected to bode well for the regional market throughout the projection period. Furthermore, due to the illegal dumping of e-waste from developed countries, as well as increased government legislation for systematic collection and recycling of electronic junk in the region, the Middle East and Africa region is predicted to register the highest CAGR throughout the forecast period.
In Sept 2023, ERI constructed three ITAD and electronics recycling facilities in order to adapt to the changing demand. According to a news release, as part of the plan, the facility in Aurora, Colorado was shut down and its operations were relocated to a newly constructed, larger recycling facility that ERI had established earlier this year near Phoenix, Arizona.
|
Report Attribute |
Specifications |
|
Market size value in 2024 |
USD 19.5 Billion |
|
Revenue forecast in 2034 |
USD 74.1 Billion |
|
Growth rate CAGR |
CAGR of 14.4% from 2025 to 2034 |
|
Quantitative units |
Representation of revenue in US$ Mn, Volume (Tons), and CAGR from 2025 to 2034 |
|
Historic Year |
2021 to 2024 |
|
Forecast Year |
2025-2034 |
|
Report coverage |
The forecast of revenue, the position of the company, the competitive market statistics, growth prospects, and trends |
|
Segments covered |
Recycler Type, Material Recovery, And Source Type |
|
Regional scope |
North America; Europe; Asia Pacific; Latin America; Middle East & Africa |
|
Country scope |
U.S.; Canada; U.K.; Germany; China; India; Japan; Brazil; Mexico; France; Italy; Spain; South Korea; Southeast Asia |
|
Competitive Landscape |
Aurubis AG, Electronic Recyclers International, Inc., SIMS Metal Management, Ltd., Umicore S.A., Boliden AB, MBA Polymers, Inc., Stena Metall AB, Enviro-Hub Holdings Ltd., Global Electric Electronic Processing Inc., and Tetronics International Ltd. |
|
Customization scope |
Free customization report with the procurement of the report, Modifications to the regional and segment scope. Particular Geographic competitive landscape. |
|
Pricing and available payment methods |
Explore pricing alternatives that are customized to your particular study requirements. |
Chapter 1. Methodology and Scope
1.1. Research Methodology
1.2. Research Scope & Assumptions
Chapter 2. Executive Summary
Chapter 3. Global E-Waste Management Market Snapshot
Chapter 4. Global E-Waste Management Market Variables, Trends & Scope
4.1. Market Segmentation & Scope
4.2. Drivers
4.3. Challenges
4.4. Trends
4.5. Investment and Funding Analysis
4.6. Industry Analysis – Porter’s Five Forces Analysis
4.7. Competitive Landscape & Market Share Analysis
4.8. Impact of Covid-19 Analysis
Chapter 5. Market Segmentation 1: by Recycler Type Estimates & Trend Analysis
5.1. by Recycler Type & Market Share, 2024 & 2034
5.2. Market Size (Value (US$ Mn) & Volume (Tons)) & Forecasts and Trend Analyses, 2021 to 2034 for the following by Recycler Type:
5.2.1. Glass Recycler
5.2.2. Metal Recycler
5.2.3. Plastic Recycler
5.2.4. Printed Circuit Board Recycler
Chapter 6. Market Segmentation 2: by Material Recovery Estimates & Trend Analysis
6.1. by Material Recovery & Market Share, 2024 & 2034
6.2. Market Size (Value (US$ Mn) & Volume (Tons)) & Forecasts and Trend Analyses, 2021 to 2034 for the following by Material Recovery:
6.2.1. Metal
6.2.2. Plastic
6.2.3. Glass
6.2.4. Others
Chapter 7. Market Segmentation 3: by Source Type Estimates & Trend Analysis
7.1. by Source Type & Market Share, 2024 & 2034
7.2. Market Size (Value (US$ Mn) & Volume (Tons)) & Forecasts and Trend Analyses, 2021 to 2034 for the following by Source Type:
7.2.1. Household Appliances
7.2.1.1. Large Household Appliances
7.2.1.1.1. Washing Machines
7.2.1.1.2. Refrigerators
7.2.1.1.3. Air Conditioners
7.2.1.2. Small Household Appliances
7.2.2. Entertainment & Consumer Electronics
7.2.2.1. Television
7.2.2.2. Others
7.2.3. I.T. and Telecommunication
7.2.3.1. Computers
7.2.3.2. Phones
7.2.3.3. Others
7.2.4. Others
Chapter 8. E-Waste Management Market Segmentation 4: Regional Estimates & Trend Analysis
8.1. North America
8.1.1. North America E-Waste Management Market Revenue (US$ Million) & Volume (Tons) Estimates and Forecasts by Recycler Type, 2021-2034
8.1.2. North America E-Waste Management Market Revenue (US$ Million) & Volume (Tons) Estimates and Forecasts by Material Recovery, 2021-2034
8.1.3. North America E-Waste Management Market Revenue (US$ Million) & Volume (Tons) Estimates and Forecasts by Source Type, 2021-2034
8.1.4. North America E-Waste Management Market Revenue (US$ Million) & Volume (Tons) Estimates and Forecasts by country, 2021-2034
8.2. Europe
8.2.1. Europe E-Waste Management Market Revenue (US$ Million) & Volume (Tons) Estimates and Forecasts by Recycler Type, 2021-2034
8.2.2. Europe E-Waste Management Market Revenue (US$ Million) & Volume (Tons) Estimates and Forecasts by Material Recovery, 2021-2034
8.2.3. Europe E-Waste Management Market Revenue (US$ Million) & Volume (Tons) Estimates and Forecasts by Source Type, 2021-2034
8.2.4. Europe E-Waste Management Market Revenue (US$ Million) & Volume (Tons) Estimates and Forecasts by country, 2021-2034
8.3. Asia Pacific
8.3.1. Asia Pacific E-Waste Management Market Revenue (US$ Million) & Volume (Tons) Estimates and Forecasts by Recycler Type, 2021-2034
8.3.2. Asia Pacific E-Waste Management Market Revenue (US$ Million) & Volume (Tons) Estimates and Forecasts by Material Recovery, 2021-2034
8.3.3. Asia-Pacific E-Waste Management Market Revenue (US$ Million) & Volume (Tons) Estimates and Forecasts by Source Type, 2021-2034
8.3.4. Asia Pacific E-Waste Management Market Revenue (US$ Million) & Volume (Tons) Estimates and Forecasts by country, 2021-2034
8.4. Latin America
8.4.1. Latin America E-Waste Management Market Revenue (US$ Million) & Volume (Tons) Estimates and Forecasts by Recycler Type, 2021-2034
8.4.2. Latin America E-Waste Management Market Revenue (US$ Million) & Volume (Tons) Estimates and Forecasts by Material Recovery, 2021-2034
8.4.3. Latin America E-Waste Management Market Revenue (US$ Million) & Volume (Tons) Estimates and Forecasts by Source Type, 2021-2034
8.4.4. Latin America E-Waste Management Market Revenue (US$ Million) & Volume (Tons) Estimates and Forecasts by country, 2021-2034
8.5. Middle East & Africa
8.5.1. Middle East & Africa E-Waste Management Market Revenue (US$ Million) & Volume (Tons) Estimates and Forecasts by Recycler Type, 2021-2034
8.5.2. Middle East & Africa E-Waste Management Market Revenue (US$ Million) & Volume (Tons) Estimates and Forecasts by Material Recovery, 2021-2034
8.5.3. Middle East & Africa E-Waste Management Market Revenue (US$ Million) & Volume (Tons) Estimates and Forecasts by Source Type, 2021-2034
8.5.4. Middle East & Africa E-Waste Management Market Revenue (US$ Million) & Volume (Tons) Estimates and Forecasts by country, 2021-2034
Chapter 9. Competitive Landscape
9.1. Major Mergers and Acquisitions/Strategic Alliances
9.2. Company Profiles
9.2.1. Aurubis AG
9.2.2. Boliden AB
9.2.3. Capital Environment Holdings Limited (Hong Kong)
9.2.4. Electronic RecyclersInternational, Inc.
9.2.5. ENIRO-HUB HOLDINGS LTD.
9.2.6. Enviro-Hub Holdings Ltd.
9.2.7. Eri (U.S.)
9.2.8. Global Electric Electronic Processing Inc.
9.2.9. MBA Polymers, Inc.
9.2.10. MRI E-Cycle Solutions
9.2.11. Sembcorp Environmental Management (Singapore)
9.2.12. Sims Lifecycle Services, Inc. (U.S.)
9.2.13. SIMS Metal Management, Ltd.
9.2.14. Stena Metall AB
9.2.15. TES-AMM
9.2.16. Tetronics International Ltd.
9.2.17. Umicore Ag & Co. Kg
9.2.18. Veolia
9.2.19. WM Intellectual Property Holdings, L.L.C. (U.S.)
9.2.20. Other Prominent Players
E-Waste Management Market By Processed Material

E-Waste Management Market- By Source
E-Waste Management Market By Application –
E-Waste Management Market By Region-
North America-
Europe-
Asia-Pacific-
Latin America-
Middle East & Africa-
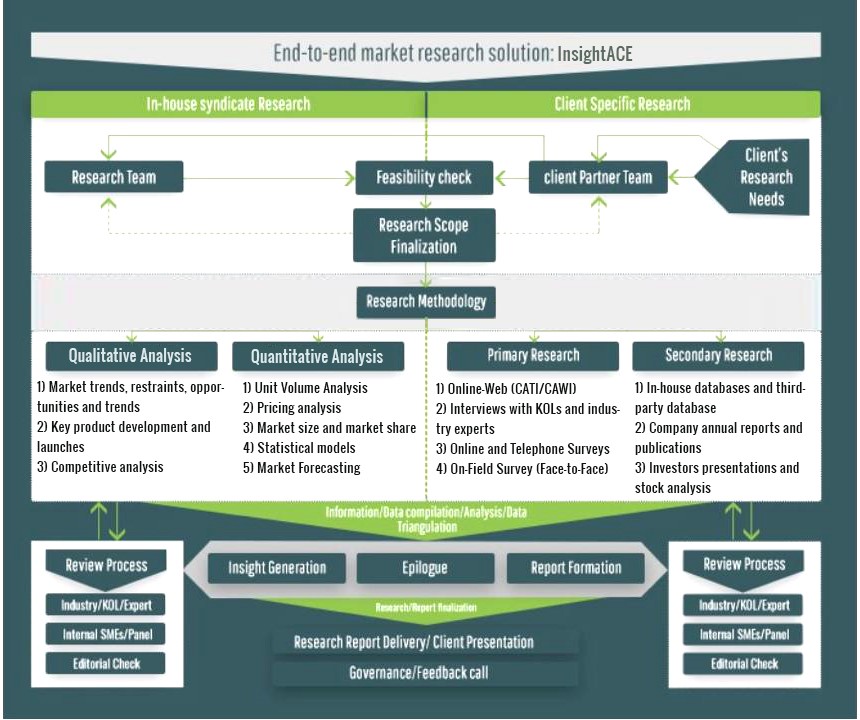
InsightAce Analytic follows a standard and comprehensive market research methodology focused on offering the most accurate and precise market insights. The methods followed for all our market research studies include three significant steps – primary research, secondary research, and data modeling and analysis - to derive the current market size and forecast it over the forecast period. In this study, these three steps were used iteratively to generate valid data points (minimum deviation), which were cross-validated through multiple approaches mentioned below in the data modeling section.
Through secondary research methods, information on the market under study, its peer, and the parent market was collected. This information was then entered into data models. The resulted data points and insights were then validated by primary participants.
Based on additional insights from these primary participants, more directional efforts were put into doing secondary research and optimize data models. This process was repeated till all data models used in the study produced similar results (with minimum deviation). This way, this iterative process was able to generate the most accurate market numbers and qualitative insights.
Secondary research
The secondary research sources that are typically mentioned to include, but are not limited to:
The paid sources for secondary research like Factiva, OneSource, Hoovers, and Statista
Primary Research:
Primary research involves telephonic interviews, e-mail interactions, as well as face-to-face interviews for each market, category, segment, and subsegment across geographies
The contributors who typically take part in such a course include, but are not limited to:
Data Modeling and Analysis:
In the iterative process (mentioned above), data models received inputs from primary as well as secondary sources. But analysts working on these models were the key. They used their extensive knowledge and experience about industry and topic to make changes and fine-tuning these models as per the product/service under study.
The standard data models used while studying this market were the top-down and bottom-up approaches and the company shares analysis model. However, other methods were also used along with these – which were specific to the industry and product/service under study.
To know more about the research methodology used for this study, kindly contact us/click here.
