
The Digital Substation Market Size is valued at USD 7.28 Bn in 2022 and is predicted to reach USD 13.77 Bn by the year 2031 at a 7.5% CAGR during the forecast period for 2023-2031.

A digital substation is a substation that has had its secondary system digitalized by replacing the majority of the analogue secondary circuits between the instrument transformers and the protection relays with digital ones. This feature of electrical generating, transmission, and distribution systems allows electric utilities and other sectors to remotely monitor, manage, and coordinate the transmission and distribution components located in the substation.
It helps the growing need for better protection and clear communication during power transmission and distribution, the rising demand due to superior benefits over traditional counterparts, the quickening pace of digitalization across the world, and the increasing demand for power supply in confined areas, all is a major driver of the expansion of the digital substation industry. As a result, demand for digital substations is expected to rise.
The global digital substation market is also propelled by the rise of automation, improved connectivity, and the increasing demand for digital substations to generate renewable energy and provide improved reliability, effectiveness, and security within the electricity distribution network. In addition, key players' increased focus on new product development and strategic collaborations led to the growth of the global digital substation market. It drives expansion globally and is expected to boost market expansion in the coming years.
However, while the demand for digital substations is expected to rise, the market's expansion is hindered by the higher upfront costs involved in switching analogue systems. Lack of technologically advanced equipment and trained people are also impeding the growth of the digital substation market in emerging economies. Furthermore, increasing R&D activities and investments by prominent players are expected to create lucrative growth opportunities in revenue for players operating in the global digital substation market over the forecast period.
The digital substation market is segmented based on modules, hardware, fibre-optic communication networks, and SCADA systems. By type, the market is segmented into transmission substations and distribution substations. By installation type, the market is segmented into new installations and retrofit installations. By voltage, the market is segmented into up to 220kV, 220-500kV, and above 500kV. By Industry, the market is segmented into utility, heavy industries, transportation, and others.
The utility industry digital substation category is expected to hold a maximum global market share in 2022 because there is a wide disparity between energy demand and supply in developing and developed countries. Increased consumer demand for clean, renewable electricity like wind, solar, and hydro has expanded the market. The utility industry is a major user of digital substations due to their widespread application in power transmission and distribution.
The new installations segment is projected to grow rapidly in the global digital substation market because of the rising need for automation, IEDs, improved communication technologies, HMI, and SCADA, as well as increased demand for new power plants and smart grids across various industries. There is less wear and tear on newer installations, and they are safer to use, especially in countries like the US, Germany, the UK, China, and India.
The North American digital substation market is expected to hold the highest market share in revenue in the near future. It can be attributed to seasoned competitors, the growing popularity of cutting-edge technology, and the rising need for power to sustain the region's factories. In addition, the presence of key market competitors and improvements in digital substation technology fuel expansion in the region's industries. In addition, Asia Pacific is projected to grow rapidly in the global digital substation market, boosted by increased demand for power due to a more sophisticated economy, a growing population and growing financial support from the business.
|
Report Attribute |
Specifications |
|
Market Size Value In 2022 |
USD 7.28 Bn |
|
Revenue Forecast In 2031 |
USD 13.77 Bn |
|
Growth Rate CAGR |
CAGR of 7.5% from 2023 to 2031 |
|
Quantitative Units |
Representation of revenue in US$ Bn and CAGR from 2023 to 2031 |
|
Historic Year |
2019 to 2022 |
|
Forecast Year |
2023-2031 |
|
Report Coverage |
The forecast of revenue, the position of the company, the competitive market structure, growth prospects, and trends |
|
Segments Covered |
Type, Module, Voltage, Installation Type, Industry, and Region |
|
Regional Scope |
North America; Europe; Asia Pacific; Latin America; Middle East & Africa |
|
Country Scope |
U.S.; Canada; U.K.; Germany; China; India; Japan; Brazil; Mexico; The UK; France; Italy; Spain; China; Japan; India; South Korea; South East Asia; South Korea; South East Asia |
|
Competitive Landscape |
ABB (Switzerland), General Electric Company (US), Siemens AG (Germany), Eaton Corporation Inc. (Ireland), Schneider Electric SE (France), Honeywell International Inc. (US), Cisco System (US), NR Electric (China), Emerson Electric Co. (US), and Larsen & Toubro Limited (India), Locamation, Efacec, Netcontrol Group, Tesco Automation, Texas Instruments, Belden Inc, NR Electric Co., Ltd., Rockwell Automation, Inc., Guodian Nanjing Automation Co., Ltd., Open System International, Inc. |
|
Customization Scope |
Free customization report with the procurement of the report, Modifications to the regional and segment scope. Particular Geographic competitive landscape. |
|
Pricing And Available Payment Methods |
Explore pricing alternatives that are customized to your particular study requirements. |
Chapter 1. Methodology and Scope
1.1. Research Methodology
1.2. Research Scope & Assumptions
Chapter 2. Executive Summary
Chapter 3. Global Digital Substation Market Snapshot
Chapter 4. Global Digital Substation Market Variables, Trends & Scope
4.1. Market Segmentation & Scope
4.2. Drivers
4.3. Challenges
4.4. Trends
4.5. Investment and Funding Analysis
4.6. Industry Analysis – Porter’s Five Forces Analysis
4.7. Competitive Landscape & Market Share Analysis
4.8. Impact of Covid-19 Analysis
Chapter 5. Market Segmentation 1: By Type Estimates & Trend Analysis
5.1. By Type, & Market Share, 2020 & 2031
5.2. Market Size (Value US$ Mn) & Forecasts and Trend Analyses, 2020 to 2030 for the following By Type:
5.2.1. Transmission Substation
5.2.2. Distribution Substation
Chapter 6. Market Segmentation 2: By Module Estimates & Trend Analysis
6.1. By Module & Market Share, 2020 & 2031
6.2. Market Size (Value US$ Mn) & Forecasts and Trend Analyses, 2020 to 2030 for the following By Module:
6.2.1. Hardware
6.2.1.1. Transformers
6.2.1.2. Busbars
6.2.1.3. Protection Devices
6.2.1.3.1. Circuit Breaker
6.2.1.3.2. Protective Relay
6.2.1.3.3. Switchgear
6.2.1.4. Interfacing Units
6.2.1.4.1. Human-machine interfaces (HMI)
6.2.1.4.2. Remote terminal units (RTU)
6.2.1.4.3. Programmable logic controllers (PLCs)
6.2.1.5. Others
6.2.2. Fiber-optic Communication Networks
6.2.3. SCADA Systems
Chapter 7. Market Segmentation 3: By Installation Type Estimates & Trend Analysis
7.1. By Installation Type & Market Share, 2020 & 2031
7.2. Market Size (Value US$ Mn) & Forecasts and Trend Analyses, 2020 to 2030 for the following By Installation Type:
7.2.1. New Installations
7.2.2. Retrofit Installations
Chapter 8. Market Segmentation 4: By Voltage Estimates & Trend Analysis
8.1. By Voltage & Market Share, 2020 & 2031
8.2. Market Size (Value US$ Mn) & Forecasts and Trend Analyses, 2020 to 2030 for the following By Voltage:
8.2.1. Up to 220kV
8.2.2. 220-500kV
8.2.3. Above 500kV
Chapter 9. Market Segmentation 5: By Industry Estimates & Trend Analysis
9.1. By Industry & Market Share, 2020 & 2031
9.2. Market Size (Value US$ Mn) & Forecasts and Trend Analyses, 2020 to 2030 for the following By Industry:
9.2.1. Utility
9.2.2. Heavy Industries
9.2.3. Transportation
9.2.4. Others
Chapter 10. Digital Substation Market Segmentation 6: Regional Estimates & Trend Analysis
10.1. North America
10.1.1. North America Digital Substation Market revenue (US$ Million) estimates and forecasts By Type, 2019-2031
10.1.2. North America Digital Substation Market revenue (US$ Million) estimates and forecasts By Module, 2019-2031
10.1.3. North America Digital Substation Market revenue (US$ Million) estimates and forecasts By Installation Type, 2019-2031
10.1.4. North America Digital Substation Market revenue (US$ Million) estimates and forecasts By Voltage, 2019-2031
10.1.5. North America Digital Substation Market revenue (US$ Million) estimates and forecasts By Industry, 2019-2031
10.1.6. North America Digital Substation Market revenue (US$ Million) estimates and forecasts by country, 2019-2031
10.2. Europe
10.2.1. Europe Digital Substation Market revenue (US$ Million) By Type, 2019-2031
10.2.2. Europe Digital Substation Market revenue (US$ Million) By Module, 2019-2031
10.2.3. Europe Digital Substation Market revenue (US$ Million) By Installation Type, 2019-2031
10.2.4. Europe Digital Substation Market revenue (US$ Million) By Voltage, 2019-2031
10.2.5. Europe Digital Substation Market revenue (US$ Million) By Industry, 2019-2031
10.2.6. Europe Digital Substation Market revenue (US$ Million) by country, 2019-2031
10.3. Asia Pacific
10.3.1. Asia Pacific Digital Substation Market revenue (US$ Million) By Type, 2019-2031
10.3.2. Asia Pacific Digital Substation Market revenue (US$ Million) By Module, 2019-2031
10.3.3. Asia Pacific Digital Substation Market revenue (US$ Million) By Installation Type, 2019-2031
10.3.4. Asia Pacific Digital Substation Market revenue (US$ Million) By Voltage, 2019-2031
10.3.5. Asia Pacific Digital Substation Market revenue (US$ Million) By Industry, 2019-2031
10.3.6. Asia Pacific Digital Substation Market revenue (US$ Million) by country, 2019-2031
10.4. Latin America
10.4.1. Latin America Digital Substation Market revenue (US$ Million) By Type, (US$ Million) 2019-2031
10.4.2. Latin America Digital Substation Market revenue (US$ Million) By Module, (US$ Million) 2019-2031
10.4.3. Latin America Digital Substation Market revenue (US$ Million) By Installation Type, (US$ Million) 2019-2031
10.4.4. Latin America Digital Substation Market revenue (US$ Million) By Voltage, (US$ Million) 2019-2031
10.4.5. Latin America Digital Substation Market revenue (US$ Million) By Industry, (US$ Million) 2019-2031
10.4.6. Latin America Digital Substation Market revenue (US$ Million) by country, 2019-2031
10.5. Middle East & Africa
10.5.1. Middle East & Africa Digital Substation Market revenue (US$ Million) By Type, (US$ Million) 2019-2031
10.5.2. Middle East & Africa Digital Substation Market revenue (US$ Million) By Module, (US$ Million) 2019-2031
10.5.3. Middle East & Africa Digital Substation Market revenue (US$ Million) By Installation Type, (US$ Million) 2019-2031
10.5.4. Middle East & Africa Digital Substation Market revenue (US$ Million) By Voltage, (US$ Million) 2019-2031
10.5.5. Middle East & Africa Digital Substation Market revenue (US$ Million) By Industry, (US$ Million) 2019-2031
10.5.6. Middle East & Africa Digital Substation Market revenue (US$ Million) by country, 2019-2031
Chapter 11. Competitive Landscape
11.1. Major Mergers and Acquisitions/Strategic Alliances
11.2. Company Profiles
11.2.1. ABB (Switzerland),
11.2.2. General Electric Company (US),
11.2.3. Siemens AG (Germany),
11.2.4. Eaton Corporation Inc. (Ireland),
11.2.5. Schneider Electric SE (France),
11.2.6. Honeywell International Inc. (US),
11.2.7. Cisco System (US),
11.2.8. NR Electric (China),
11.2.9. Emerson Electric Co. (US),
11.2.10. Larsen & Toubro Limited (India)
Digital Substation Market By Module -

Digital Substation Market By Type -
Digital Substation Market By Installation Type -
Digital Substation Market By Voltage-
Digital Substation Market By Industry-
Digital Substation Market By Region-
North America-
Europe-
Asia-Pacific-
Latin America-
Middle East & Africa-
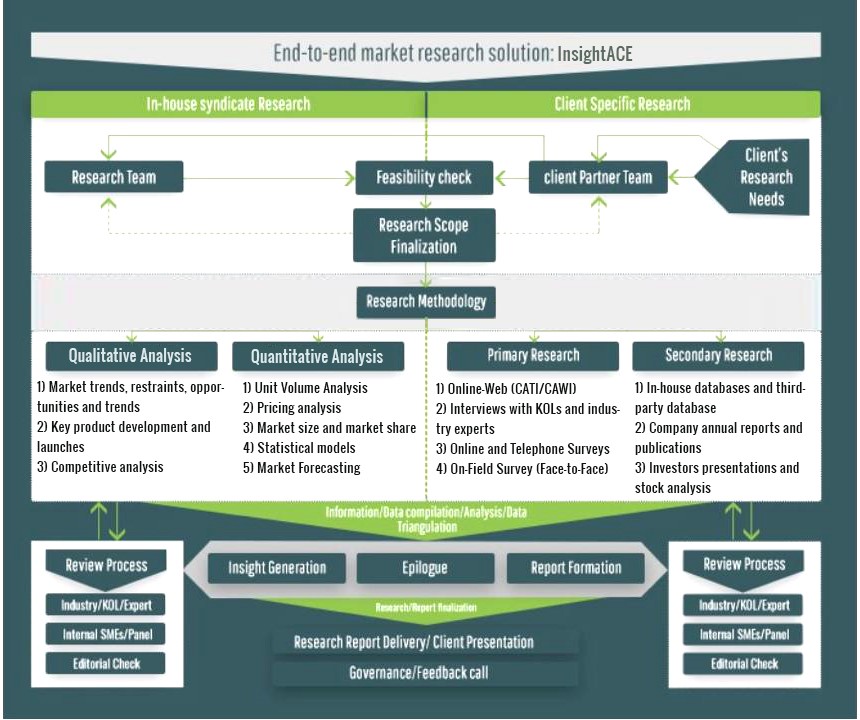
InsightAce Analytic follows a standard and comprehensive market research methodology focused on offering the most accurate and precise market insights. The methods followed for all our market research studies include three significant steps – primary research, secondary research, and data modeling and analysis - to derive the current market size and forecast it over the forecast period. In this study, these three steps were used iteratively to generate valid data points (minimum deviation), which were cross-validated through multiple approaches mentioned below in the data modeling section.
Through secondary research methods, information on the market under study, its peer, and the parent market was collected. This information was then entered into data models. The resulted data points and insights were then validated by primary participants.
Based on additional insights from these primary participants, more directional efforts were put into doing secondary research and optimize data models. This process was repeated till all data models used in the study produced similar results (with minimum deviation). This way, this iterative process was able to generate the most accurate market numbers and qualitative insights.
Secondary research
The secondary research sources that are typically mentioned to include, but are not limited to:
The paid sources for secondary research like Factiva, OneSource, Hoovers, and Statista
Primary Research:
Primary research involves telephonic interviews, e-mail interactions, as well as face-to-face interviews for each market, category, segment, and subsegment across geographies
The contributors who typically take part in such a course include, but are not limited to:
Data Modeling and Analysis:
In the iterative process (mentioned above), data models received inputs from primary as well as secondary sources. But analysts working on these models were the key. They used their extensive knowledge and experience about industry and topic to make changes and fine-tuning these models as per the product/service under study.
The standard data models used while studying this market were the top-down and bottom-up approaches and the company shares analysis model. However, other methods were also used along with these – which were specific to the industry and product/service under study.
To know more about the research methodology used for this study, kindly contact us/click here.4456
