
Biorational Product Market Size is valued at 8.5 billion in 2024 and is predicted to reach 51.9 billion by the year 2034 at an 20.0% CAGR during the forecast period for 2025-2034.

The insecticides are known as "biorational products" are relatively non-toxic to humans and have little negative impact on the environment. These are primarily obtained from natural and organic sources, including biological insecticides, products for managing crop stress, improved plant physiology advantages, and goods for controlling root growth.
Although biorational goods have been on the market for a while, the market has grown significantly during the past five years in revenue and customer acceptance. Biorational products are in high demand due to the growing concern over pesticide residues in food and the issue of pest resistance, as well as the increasing adoption of the "green crop protection" concept globally.It is anticipated that regulators in many nations will continue significantly cutting maximum residue limits (MRLs). The benefits of sustainability, crop quality, and harvest flexibility make rational goods a worthwhile alternative. To increase their market position, the firms operating in the global biorational product market have introduced a wide range of products and altered the market structure through multiple agreements, collaborations, and partnerships.
The Biorational product market is segmented on the type and crop type. Based on type, the market is segmented into micronutrient fertilizers, slow-release fertilizers, controlled-release fertilizers, customized fertilizers, water-soluble fertilizers and others. Based on crop type, biorational product market is segmented into pulses and oilseeds, grains and cerals, commercial crops, fruits and vegetables and others.
The water-soluble fertilizers category grabbed the highest revenue share, and it is anticipated that they will continue to hold that position during the anticipated time. Using chemical insecticides has raised many serious concerns, such as environmental pollution, degradation, and the loss of fauna that is beneficial to humans. The global agriculture sector is facing significant challenges driven by increasing food demand due to a rapidly growing global population. Given this, there is a great demand for biorational pesticides made from natural sources that do not harm the environment. These insecticides are extensively used since they are less expensive and help to lessen negative ecological effects. These might take the role of traditional insecticides, assuring food security and validating the cost-benefit analysis.
The botanical category is anticipated to grow significantly over the forecast period. Natural pesticides generated from plants and animals and have innately protective qualities are known as botanical pesticides. As they are less hazardous to the environment and human health, botanical pesticides are currently used as substitutes for synthetic chemical pesticides. Demand for botanicals is driven by causes such as rising environmental pollution levels brought on by the overuse of chemical pesticides and rising costs of synthetic pesticides. In addition to helping to repair damage from chemical pesticides, these compounds are also used to battle agricultural pests and plant diseases. These elements are anticipated to fuel this segment's revenue growth over the course of the forecast.
The Asia Pacific biorational product market is expected to register the highest market share in revenue in the near future due to the region's countries' steadily rising agricultural sector activity and the growing usage of bio-insecticides in crops. Another significant factor propelling the growth of the Asia Pacific biorational product market is the rising demand for healthy organic products.
In addition, North America is projected to grow rapidly in the global biorational product market due to the significant presence of top businesses in the region, including Monsanto Company, Inora Biotech Pvt. Ltd., and BioWorks Inc. The economy and infrastructure in this region are predicted to grow quickly, which will positively impact market revenue. Domestic production and consumption are anticipated to fuel the market growth for biorational products along with increased import and export activity.
|
Report Attribute |
Specifications |
|
Market size value in 2024 |
USD 8.5 billion |
|
Revenue forecast in 2034 |
USD 51.9 billion |
|
Growth rate CAGR |
CAGR of 20.0% from 2025 to 2034 |
|
Quantitative units |
Representation of revenue in US$ Million, and CAGR from 2025 to 2034 |
|
Historic Year |
2021 to 2024 |
|
Forecast Year |
2025-2034 |
|
Report coverage |
The forecast of revenue, the position of the company, the competitive market structure, growth prospects, and trends |
|
Segments covered |
Type, Crop Type |
|
Regional scope |
North America; Europe; Asia Pacific; Latin America; Middle East & Africa |
|
Country scope |
U.S.; Canada; U.K.; Germany; China; India; Japan; Brazil; Mexico ;The UK; France; Italy; Spain; South Korea; South East Asia |
|
Competitive Landscape |
Agralan Ltd., BASF SE, Bayer Agrar Germany, Bioworks, Inc, Gowan Company LLC, Inora Biotech Pvt. Ltd., Isagro S.P.A, Koppet Biological Systems, Monsanto Company, Nufarm Limited |
|
Customization scope |
Free customization report with the procurement of the report, Modifications to the regional and segment scope. Particular Geographic competitive landscape. |
|
Pricing and available payment methods |
Explore pricing alternatives that are customized to your particular study requirements. |
Chapter 1. Methodology and Scope
1.1. Research Methodology
1.2. Research Scope & Assumptions
Chapter 2. Executive Summary
Chapter 3. Global Biorational Product Market Snapshot
Chapter 4. Global Biorational Product Market Variables, Trends & Scope
4.1. Market Segmentation & Scope
4.2. Drivers
4.3. Challenges
4.4. Trends
4.5. Investment and Funding Analysis
4.6. Industry Analysis – Porter’s Five Forces Analysis
4.7. Competitive Landscape & Market Share Analysis
4.8. Impact of Covid-19 Analysis
Chapter 5. Market Segmentation 1: by Product Type Estimates & Trend Analysis
5.1. by Product Type & Market Share, 2024 & 2034
5.2. Market Size (Value (US$ Mn)) & Forecasts and Trend Analyses, 2021 to 2034 for the following by Product Type:
5.2.1. Insecticides
5.2.2. Fungicides
5.2.3. Nematicides
Chapter 6. Market Segmentation 2: by Source Estimates & Trend Analysis
6.1. by Source & Market Share, 2024 & 2034
6.2. Market Size (Value (US$ Mn)) & Forecasts and Trend Analyses, 2021 to 2034 for the following by Source:
6.2.1. Botanical
6.2.2. Microbial
6.2.3. Non-organic
Chapter 7. Market Segmentation 3: by Mode of Application Estimates & Trend Analysis
7.1. by Mode of Application & Market Share, 2024 & 2034
7.2. Market Size (Value (US$ Mn)) & Forecasts and Trend Analyses, 2021 to 2034 for the following by Mode of Application:
7.2.1. Foliar Spray
7.2.2. Soil Treatment
7.2.3. Trunk Injection
Chapter 8. Biorational Product Market Segmentation 4: Regional Estimates & Trend Analysis
8.1. North America
8.1.1. North America Biorational Product Market Revenue (US$ Million) Estimates and Forecasts by Product Type, 2021-2034
8.1.2. North America Biorational Product Market Revenue (US$ Million) Estimates and Forecasts by Source, 2021-2034
8.1.3. North America Biorational Product Market Revenue (US$ Million) Estimates and Forecasts by Mode of Application, 2021-2034
8.1.4. North America Biorational Product Market Revenue (US$ Million) Estimates and Forecasts by country, 2021-2034
8.2. Europe
8.2.1. Europe Biorational Product Market Revenue (US$ Million) Estimates and Forecasts by Product Type, 2021-2034
8.2.2. Europe Biorational Product Market Revenue (US$ Million) Estimates and Forecasts by Source, 2021-2034
8.2.3. Europe Biorational Product Market Revenue (US$ Million) Estimates and Forecasts by Mode of Application, 2021-2034
8.2.4. Europe Biorational Product Market Revenue (US$ Million) Estimates and Forecasts by country, 2021-2034
8.3. Asia Pacific
8.3.1. Asia Pacific Biorational Product Market Revenue (US$ Million) Estimates and Forecasts by Product Type, 2021-2034
8.3.2. Asia Pacific Biorational Product Market Revenue (US$ Million) Estimates and Forecasts by Source, 2021-2034
8.3.3. Asia-Pacific Biorational Product Market Revenue (US$ Million) Estimates and Forecasts by Mode of Application, 2021-2034
8.3.4. Asia Pacific Biorational Product Market Revenue (US$ Million) Estimates and Forecasts by country, 2021-2034
8.4. Latin America
8.4.1. Latin America Biorational Product Market Revenue (US$ Million) Estimates and Forecasts by Product Type, 2021-2034
8.4.2. Latin America Biorational Product Market Revenue (US$ Million) Estimates and Forecasts by Source, 2021-2034
8.4.3. Latin America Biorational Product Market Revenue (US$ Million) Estimates and Forecasts by Mode of Application, 2021-2034
8.4.4. Latin America Biorational Product Market Revenue (US$ Million) Estimates and Forecasts by country, 2021-2034
8.5. Middle East & Africa
8.5.1. Middle East & Africa Biorational Product Market Revenue (US$ Million) Estimates and Forecasts by Product Type, 2021-2034
8.5.2. Middle East & Africa Biorational Product Market Revenue (US$ Million) Estimates and Forecasts by Source, 2021-2034
8.5.3. Middle East & Africa Biorational Product Market Revenue (US$ Million) Estimates and Forecasts by Mode of Application, 2021-2034
8.5.4. Middle East & Africa Biorational Product Market Revenue (US$ Million) Estimates and Forecasts by country, 2021-2034
Chapter 9. Competitive Landscape
9.1. Major Mergers and Acquisitions/Strategic Alliances
9.2. Company Profiles
9.2.1. Agralan Ltd.
9.2.2. BASF SE
9.2.3. Bayer Agrar Germany
9.2.4. Bioworks, Inc
9.2.5. Gowan Company LLC
9.2.6. Inora Biotech Pvt. Ltd.
9.2.7. Isagro S.P.A
9.2.8. Koppet Biological Systems
9.2.9. Monsanto Company
9.2.10. Nufarm Limited
9.2.11. Other Prominent Players
Biorational Product Market By Type

Biorational Product Market By Source
Biorational Product Market By Mode of Application
Biorational Product Market By Region-
North America-
Europe-
Asia-Pacific-
Latin America-
Middle East & Africa-
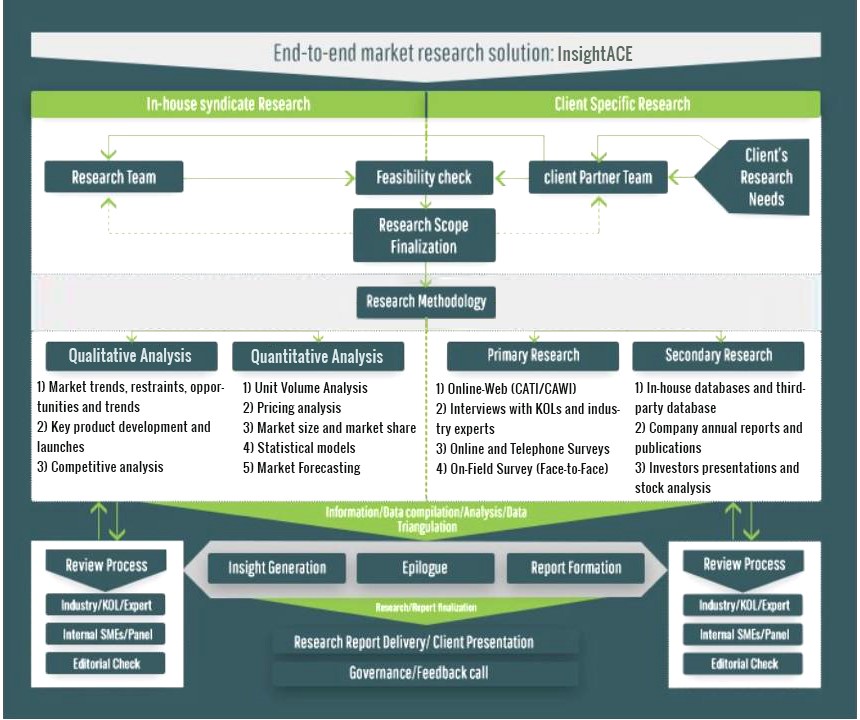
InsightAce Analytic follows a standard and comprehensive market research methodology focused on offering the most accurate and precise market insights. The methods followed for all our market research studies include three significant steps – primary research, secondary research, and data modeling and analysis - to derive the current market size and forecast it over the forecast period. In this study, these three steps were used iteratively to generate valid data points (minimum deviation), which were cross-validated through multiple approaches mentioned below in the data modeling section.
Through secondary research methods, information on the market under study, its peer, and the parent market was collected. This information was then entered into data models. The resulted data points and insights were then validated by primary participants.
Based on additional insights from these primary participants, more directional efforts were put into doing secondary research and optimize data models. This process was repeated till all data models used in the study produced similar results (with minimum deviation). This way, this iterative process was able to generate the most accurate market numbers and qualitative insights.
Secondary research
The secondary research sources that are typically mentioned to include, but are not limited to:
The paid sources for secondary research like Factiva, OneSource, Hoovers, and Statista
Primary Research:
Primary research involves telephonic interviews, e-mail interactions, as well as face-to-face interviews for each market, category, segment, and subsegment across geographies
The contributors who typically take part in such a course include, but are not limited to:
Data Modeling and Analysis:
In the iterative process (mentioned above), data models received inputs from primary as well as secondary sources. But analysts working on these models were the key. They used their extensive knowledge and experience about industry and topic to make changes and fine-tuning these models as per the product/service under study.
The standard data models used while studying this market were the top-down and bottom-up approaches and the company shares analysis model. However, other methods were also used along with these – which were specific to the industry and product/service under study.
To know more about the research methodology used for this study, kindly contact us/click here.
