
Global Active Pharmaceutical Ingredients Market Size is valued at USD 178.2 Billion in 2024 and is predicted to reach USD 374.6 Billion by the year 2034 at a 7.8% CAGR during the forecast period for 2025-2034.

Improvements in the production of active pharmaceutical ingredients (APIs) and the rise in chronic diseases, such as cancer and cardiovascular conditions, are responsible for the growth. In addition to altering geopolitical conditions, supportive government regulations for API production are accelerating market expansion.
Due to COVID-19's supply chain disruption, the API market is witnessing significant changes. Due to geopolitical circumstances and the desire to lessen reliance on China for API products, nations like India are favored over China for exporting API. The governments of numerous countries have also developed policies and provided incentives to encourage the production of API.
The global APIs market benefited from the COVID-19 pandemic. The pharmaceutical sector was key in treating COVID-19 symptoms such as high fever, cough, and cold. The active pharmaceutical components market expanded during the pandemic due to the pharma sector's increased prominence. After the COVID-19 outbreak was classified as a pandemic by the World Health Organization, a wide range of renowned pharmaceutical and biopharmaceutical businesses and fresh startups rushed up to develop treatments for the virus.
The active pharmaceutical ingredients market is segmented by type, synthesis, type of drug, potency, therapeutic applications, end-user. Based on type, the market is segmented into innovative APIs and generic APIs, the market is segmented by synthesis into synthetic APIs and biotech APIs, the market is segmented on the basis of type of drugs into prescription and over the counter, the market is segmented on the basis of potency into traditional APIs and high potency APIs, on the basis of therapeutic applications market is segmented into communicable diseases, oncology, diabetes, cardiovascular diseases, respiratory diseases, pain management and others therapeutic application, on the basis of end-user the market is segmented into pharmaceutical & biotechnology industry, contract research organization, contract manufacturing organization, Others.
Inventive APIs controlled the majority. Increased R&D initiatives for the creation of innovative drugs and helpful government laws are credited with this expansion. Numerous innovative items are currently being developed as a consequence of intensive research in this area and are anticipated to be on sale throughout the projected period. It is anticipated that new players in this sector will fuel market expansion.
North America now dominates the market for active pharmaceutical components, which is anticipated to last a few more years. Due to rising disease rates and an ageing population, this area is anticipated to see a gain in market share in the future. The country had to import many APIs from other countries because of the country's severe COVID-19 outbreak, and domestic producers also had to ramp up production to meet the demand.
The majority of its API needs are satisfied by imports from Asian markets. According to US trade statistics, China and India account for roughly 75–80% of all APIs imported into the US since they have well-established production bases and a significant labour force that caters to the pharmaceutical industry. Recent political and trade initiatives of the US government to raise import levies and taxes are anticipated to increase operational expenses and put more pressure on manufacturers' pricing. In order to guarantee the supply of high-quality goods to the US market, the FDA has also raised the application costs for brand-new medicine approvals and increased the frequency of periodic inspections carried out at various offshore contract manufacturing facilities.
|
Report Attribute |
Specifications |
|
Market size value in 2024 |
USD 178.2 Billion |
|
Revenue forecast in 2034 |
USD 374.6 Billion |
|
Growth rate CAGR |
CAGR of 7.8% from 2025 to 2034 |
|
Quantitative units |
Representation of revenue in US$ Mn,, and CAGR from 2025 to 2034 |
|
Historic Year |
2021 to 2024 |
|
Forecast Year |
2025-2034 |
|
Report coverage |
The forecast of revenue, the position of the company, the competitive market statistics, growth prospects, and trends |
|
Segments covered |
By Type, By Synthesis, By Type of Drug, By Potency, By Therapeutic Application, By End-User |
|
Regional scope |
North America; Europe; Asia Pacific; Latin America; Middle East & Africa |
|
Country scope |
U.S.; Canada; U.K.; Germany; China; India; Japan; Brazil; Mexico; The UK; France; Italy; Spain; China; Japan; India; South Korea; Southeast Asia; South Korea; Southeast Asia |
|
Competitive Landscape |
Pfizer Inc., Teva Pharmaceutical Industries Ltd., GSK PLC, Sanofi, Viatris Inc., Divi's Laboratories Limited, Sandoz Group AG, Boehringer Ingelheim International Gmbh, Sk Inc., Eli Lilly And Company, Merck Kgaa, Abbvie Inc., F. Hoffmann-La Roche Ltd., Astrazeneca, Dr. Reddy’s Laboratories Ltd., Sun Pharmaceutical Industries Ltd., Cipla, Evonik Industries Ag, Hikma Pharmaceuticals Plc, BASF SE, Alembic Pharmaceuticals Limited |
|
Customization scope |
Free customization report with the procurement of the report, Modifications to the regional and segment scope. Particular Geographic competitive landscape. |
|
Pricing and available payment methods |
Explore pricing alternatives that are customized to your particular study requirements. |
Chapter 1. Methodology and Scope
1.1. Research Methodology
1.2. Research Scope & Assumptions
Chapter 2. Executive Summary
Chapter 3. Global Active Pharmaceutical Ingredients Market Snapshot
Chapter 4. Global Active Pharmaceutical Ingredients Market Variables, Trends & Scope
4.1. Market Segmentation & Scope
4.2. Drivers
4.3. Challenges
4.4. Trends
4.5. Industry Analysis – Porter’s Five Forces Analysis
4.6. Competitive Landscape & Market Share Analysis
4.7. Impact of Covid-19 Analysis
Chapter 5. Market Segmentation 1: By Type, Estimates & Trend Analysis
5.1. By Type, & Market Share, 2024 & 2034
5.2. Market Size (Value US$ Mn) & Forecasts and Trend Analyses, 2021 to 2034 for the following By Type:
5.2.1. Innovative APIs
5.2.2. Generic APIs
Chapter 6. Market Segmentation 2: By Synthesis Estimates & Trend Analysis
6.1. By Synthesis & Market Share, 2024 & 2034
6.2. Market Size (Value US$ Mn) & Forecasts and Trend Analyses, 2021 to 2034 for the following By Synthesis:
6.2.1. Synthetic APIs
6.2.2. Innovative Synthetic APIs
6.2.2.1. Generic Synthetic APIs
6.2.3. Biotech APIs
6.2.3.1. By Type
6.2.3.1.1. Innovative Biotech APIs
6.2.3.1.2. Generic Biotech APIs
6.2.3.2. By Product
6.2.3.2.1. Monoclonal Antibodies
6.2.3.2.2. Hormones and Growth Factors
6.2.3.2.3. Fusion proteins
6.2.3.2.4. Cytokines
6.2.3.2.5. Therapeutic enzymes
6.2.3.2.6. Blood factors and Anti-coagulants
6.2.3.2.7. Recombinant vaccines
6.2.3.3. By Expression Systems
6.2.3.3.1. Mammalian expression systems
6.2.3.3.2. Microbial expression systems
6.2.3.3.3. Yeast expression systems
6.2.3.3.4. Insect expression systems
6.2.3.3.5. Other expression system
Chapter 7. Market Segmentation 3: By Type of Drug Estimates & Trend Analysis
7.1. By Type of Drug & Market Share, 2024 & 2034
7.2. Market Size (Value US$ Mn) & Forecasts and Trend Analyses, 2021 to 2034 for the following By Type of Drug:
7.2.1. Prescription
7.2.2. Over the Counter
Chapter 8. Market Segmentation 4: By Potency Estimates & Trend Analysis
8.1. By Potency & Market Share, 2024 & 2034
8.2. Market Size (Value US$ Mn) & Forecasts and Trend Analyses, 2021 to 2034 for the following By Potency:
8.2.1. Traditional APIs
8.2.2. High Potency APIs
Chapter 9. Market Segmentation 5: By End-User Estimates & Trend Analysis
9.1. By End-User & Market Share, 2024 & 2034
9.2. Market Size (Value US$ Mn) & Forecasts and Trend Analyses, 2021 to 2034 for the following By End-User:
9.2.1. Pharmaceutical & Biotechnology Industry
9.2.2. Contract Research Organization
9.2.3. Contract manufacturing Organization
9.2.4. Others
Chapter 10. Active Pharmaceutical Ingredients Market Segmentation 6: Regional Estimates & Trend Analysis
10.1. North America
10.1.1. North America Active Pharmaceutical Ingredients Market revenue (US$ Million) estimates and forecasts By Type, 2021-2034
10.1.2. North America Active Pharmaceutical Ingredients Market revenue (US$ Million) estimates and forecasts By Synthesis, 2021-2034
10.1.3. North America Active Pharmaceutical Ingredients Market revenue (US$ Million) estimates and forecasts By Type of Drug, 2021-2034
10.1.4. North America Active Pharmaceutical Ingredients Market revenue (US$ Million) estimates and forecasts By Potency, 2021-2034
10.1.5. North America Active Pharmaceutical Ingredients Market revenue (US$ Million) estimates and forecasts By End-User, 2021-2034
10.1.6. North America Active Pharmaceutical Ingredients Market revenue (US$ Million) estimates and forecasts by country, 2021-2034
10.2. Europe
10.2.1. Europe Active Pharmaceutical Ingredients Market revenue (US$ Million) By Type, 2021-2034
10.2.2. Europe Active Pharmaceutical Ingredients Market revenue (US$ Million) By Synthesis, 2021-2034
10.2.3. Europe Active Pharmaceutical Ingredients Market revenue (US$ Million) By Type of Drug, 2021-2034
10.2.4. Europe Active Pharmaceutical Ingredients Market revenue (US$ Million) By Potency, 2021-2034
10.2.5. Europe Active Pharmaceutical Ingredients Market revenue (US$ Million) By End-User, 2021-2034
10.2.6. Europe Active Pharmaceutical Ingredients Market revenue (US$ Million) by country, 2021-2034
10.3. Asia Pacific
10.3.1. Asia Pacific Active Pharmaceutical Ingredients Market revenue (US$ Million) By Type, 2021-2034
10.3.2. Asia Pacific Active Pharmaceutical Ingredients Market revenue (US$ Million) By Synthesis, 2021-2034
10.3.3. Asia Pacific Active Pharmaceutical Ingredients Market revenue (US$ Million) By Type of Drug, 2021-2034
10.3.4. Asia Pacific Active Pharmaceutical Ingredients Market revenue (US$ Million) By Potency, 2021-2034
10.3.5. Asia Pacific Active Pharmaceutical Ingredients Market revenue (US$ Million) By End-User, 2021-2034
10.3.6. Asia Pacific Active Pharmaceutical Ingredients Market revenue (US$ Million) by country, 2021-2034
10.4. Latin America
10.4.1. Latin America Active Pharmaceutical Ingredients Market revenue (US$ Million) By Type, (US$ Million) 2021-2034
10.4.2. Latin America Active Pharmaceutical Ingredients Market revenue (US$ Million) By Synthesis, (US$ Million) 2021-2034
10.4.3. Latin America Active Pharmaceutical Ingredients Market revenue (US$ Million) By Type of Drug, (US$ Million) 2021-2034
10.4.4. Latin America Active Pharmaceutical Ingredients Market revenue (US$ Million) By Potency, (US$ Million) 2021-2034
10.4.5. Latin America Active Pharmaceutical Ingredients Market revenue (US$ Million) By End-User, (US$ Million) 2021-2034
10.4.6. Latin America Active Pharmaceutical Ingredients Market revenue (US$ Million) by country, 2021-2034
10.5. Middle East & Africa
10.5.1. Middle East & Africa Active Pharmaceutical Ingredients Market revenue (US$ Million) By Type, (US$ Million) 2021-2034
10.5.2. Middle East & Africa Active Pharmaceutical Ingredients Market revenue (US$ Million) By Synthesis, (US$ Million) 2021-2034
10.5.3. Middle East & Africa Active Pharmaceutical Ingredients Market revenue (US$ Million) By Type of Drug, (US$ Million) 2021-2034
10.5.4. Middle East & Africa Active Pharmaceutical Ingredients Market revenue (US$ Million) By Potency, (US$ Million) 2021-2034
10.5.5. Middle East & Africa Active Pharmaceutical Ingredients Market revenue (US$ Million) By End-User, (US$ Million) 2021-2034
10.5.6. Middle East & Africa Active Pharmaceutical Ingredients Market revenue (US$ Million) by country, 2021-2034
Chapter 11. Competitive Landscape
11.1. Major Mergers and Acquisitions/Strategic Alliances
11.2. Company Profiles
11.2.1. UPL
11.2.2. Pfizer Inc.
11.2.3. Teva Pharmaceutical Industries Ltd.
11.2.4. GSK PLC
11.2.5. Sanofi
11.2.6. Viatris Inc.
11.2.7. Divi's Laboratories Limited
11.2.8. Sandoz Group AG
11.2.9. Boehringer Ingelheim International Gmbh
11.2.10. Sk Inc.
11.2.11. Eli Lilly And Company
11.2.12. Merck Kgaa
11.2.13. Abbvie Inc.
11.2.14. F. Hoffmann-La Roche Ltd.
11.2.15. Astrazeneca
11.2.16. Dr. Reddy’s Laboratories Ltd.
11.2.17. Sun Pharmaceutical Industries Ltd.
11.2.18. Cipla
11.2.19. Evonik Industries Ag
11.2.20. Hikma Pharmaceuticals Plc
11.2.21. BASF SE
11.2.22. Alembic Pharmaceuticals Limited
11.2.23. Other Prominent Players
Active Pharmaceutical Ingredients Market- By Type

Active Pharmaceutical Ingredients Market- By Synthesis
Active Pharmaceutical Ingredients Market- By Type of Drug
Active Pharmaceutical Ingredients Market- By Potency
Active Pharmaceutical Ingredients Market- By End User
Active Pharmaceutical Ingredients Market By Region-
North America-
Europe-
Asia-Pacific-
Latin America-
Middle East & Africa-
InsightAce Analytic follows a standard and comprehensive market research methodology focused on offering the most accurate and precise market insights. The methods followed for all our market research studies include three significant steps – primary research, secondary research, and data modeling and analysis - to derive the current market size and forecast it over the forecast period. In this study, these three steps were used iteratively to generate valid data points (minimum deviation), which were cross-validated through multiple approaches mentioned below in the data modeling section.
Through secondary research methods, information on the market under study, its peer, and the parent market was collected. This information was then entered into data models. The resulted data points and insights were then validated by primary participants.
Based on additional insights from these primary participants, more directional efforts were put into doing secondary research and optimize data models. This process was repeated till all data models used in the study produced similar results (with minimum deviation). This way, this iterative process was able to generate the most accurate market numbers and qualitative insights.
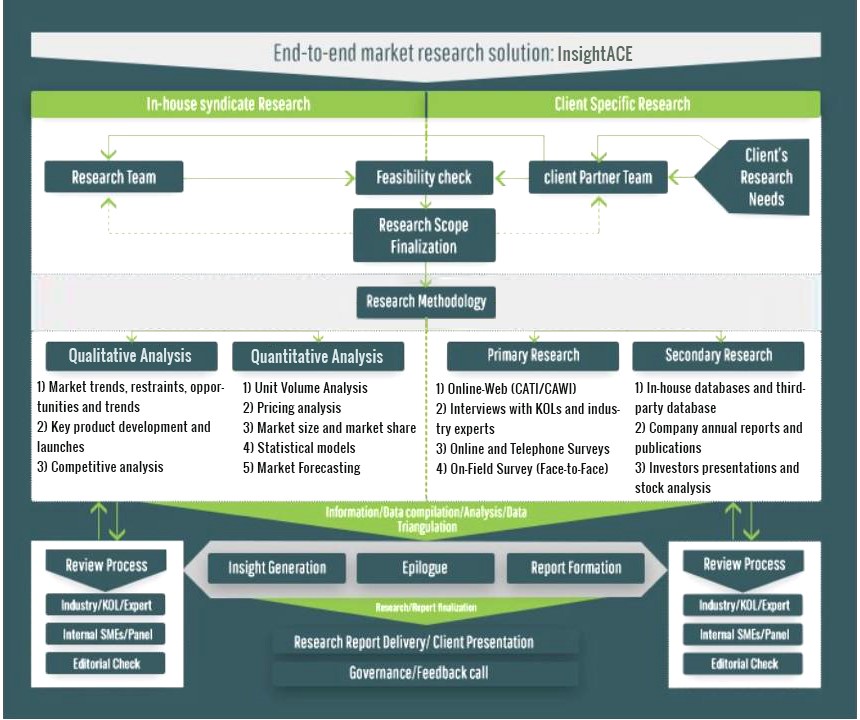
Secondary research
The secondary research sources that are typically mentioned to include, but are not limited to:
The paid sources for secondary research like Factiva, OneSource, Hoovers, and Statista
Primary Research:
Primary research involves telephonic interviews, e-mail interactions, as well as face-to-face interviews for each market, category, segment, and subsegment across geographies
The contributors who typically take part in such a course include, but are not limited to:
Data Modeling and Analysis:
In the iterative process (mentioned above), data models received inputs from primary as well as secondary sources. But analysts working on these models were the key. They used their extensive knowledge and experience about industry and topic to make changes and fine-tuning these models as per the product/service under study.
The standard data models used while studying this market were the top-down and bottom-up approaches and the company shares analysis model. However, other methods were also used along with these – which were specific to the industry and product/service under study.
To know more about the research methodology used for this study, kindly contact us/click here.
